Fig. 3
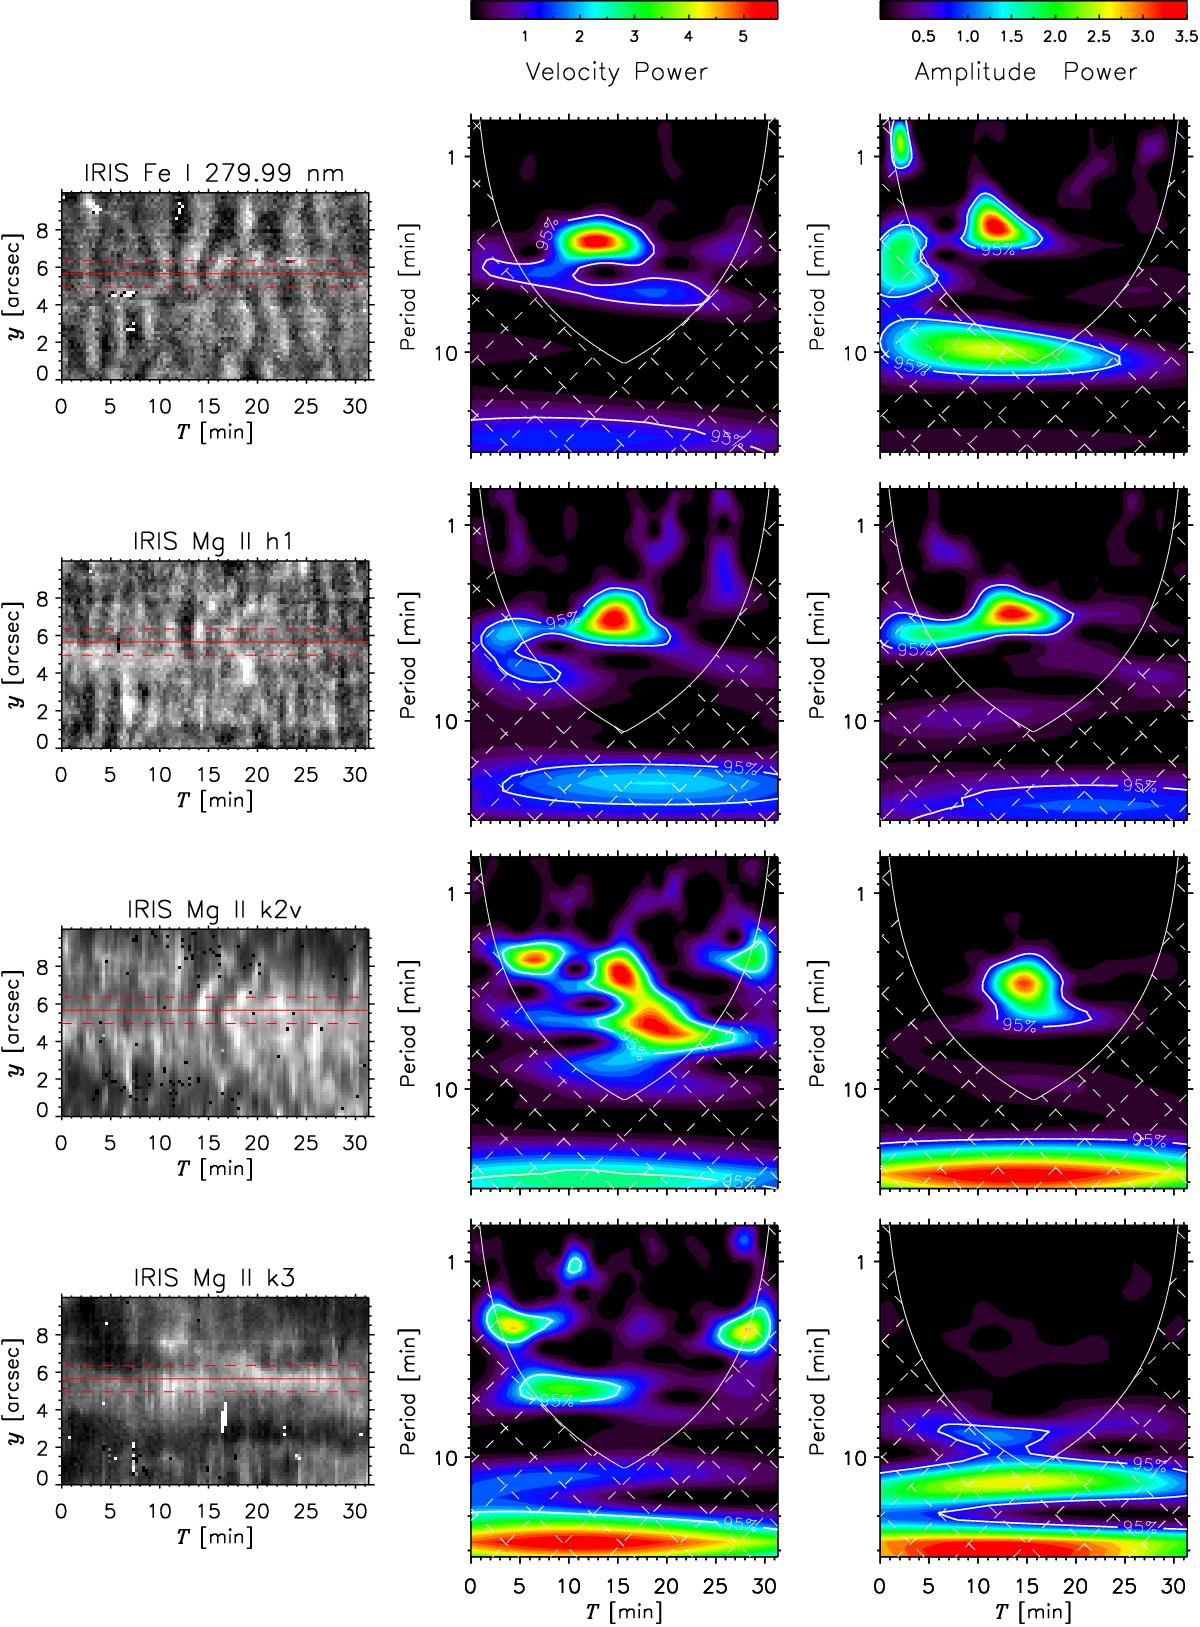
Left to right: upper row: a time-space image retrieved from the velocity parameter of the Fe i 2799.9 Å line (±1.9 km s-1) obtained from the IRIS slit spectra using the MOSiC code. The dashed and solid horizontal red lines mark again the same region as in Fig. 2. The next two panels show the power for the velocity and the intensity fluctuations at periods ranging from 0.6 min to 21 min at the slit location marked with the red solid horizontal line in the first panel. The power is shown in a logarithmic scale with the hashed area marking periods in which the wavelet analysis yields untrustworthy results. The results obtained with a confidence level of 95% are contoured with a white solid line (not all are labeled). The following rows are in the same format as the first row, now showing first maps of the Mg ii h1 minimum obtained through the MOSiC code and the Mg ii k2v peak and the Mg ii k3 core obtained with the iris_get_mg_features_lev2.pro code, where blacked out or white pixels signify a failed feature finding. The power for the velocity and the intensity fluctuations for these parameters are shown in the second and third panels in each row.
Current usage metrics show cumulative count of Article Views (full-text article views including HTML views, PDF and ePub downloads, according to the available data) and Abstracts Views on Vision4Press platform.
Data correspond to usage on the plateform after 2015. The current usage metrics is available 48-96 hours after online publication and is updated daily on week days.
Initial download of the metrics may take a while.