Fig. 2
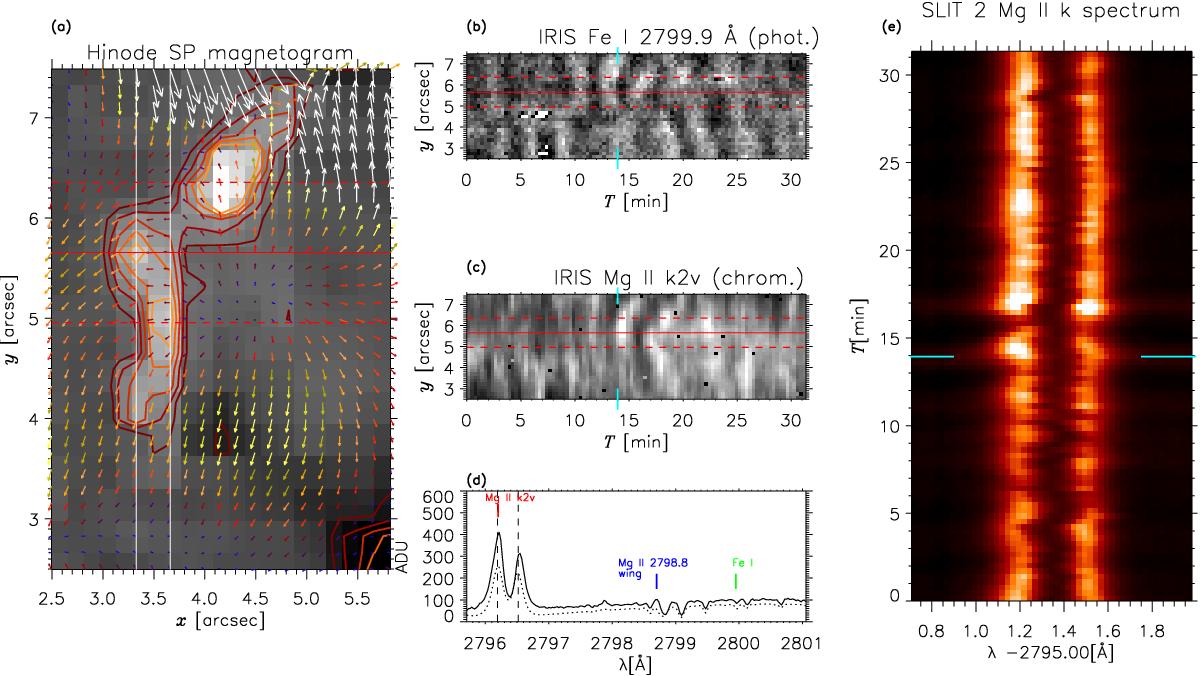
Left to right: panel a): Hinode SP ![]() map now rebinned to the IRIS slitjaw scale with the same contours as in the second row of Fig. 1 and the horizontal flows indicated with colored arrows as in Fig. 1. The two vertical white lines delimit the position of the IRIS slit in use. Two dashed red horizontal lines and a solid red line mark a region of interest. Panels b) and c) are time-space images derived from spectra recorded by the second IRIS slit. Panel b): line-core velocity of the Fe i 2799.9 Å line (±1.9 km s-1, where down flows are positive) retrieved with the MOSiC code (Rezaei 2017). Panel c): the intensity of the Mg ii k2v peak (in data units) obtained by the iris_get_mg_features_lev2.pro code is plotted. The red horizontal lines indicate the same area as in panel a). The short vertical lines in cyan indicate the time of the map in panel a), and panel d) shows a spectrum at that time (solid) and average quiet Sun spectrum (dotted). The dashed vertical lines denote the average position of the Mg ii k2 peaks. The right panel demonstrates the temporal evolution of the IRIS slit spectra at the slit location marked by the solid red horizontal line in panels a) to c) with the time of panel a) indicated again with lines in cyan.
map now rebinned to the IRIS slitjaw scale with the same contours as in the second row of Fig. 1 and the horizontal flows indicated with colored arrows as in Fig. 1. The two vertical white lines delimit the position of the IRIS slit in use. Two dashed red horizontal lines and a solid red line mark a region of interest. Panels b) and c) are time-space images derived from spectra recorded by the second IRIS slit. Panel b): line-core velocity of the Fe i 2799.9 Å line (±1.9 km s-1, where down flows are positive) retrieved with the MOSiC code (Rezaei 2017). Panel c): the intensity of the Mg ii k2v peak (in data units) obtained by the iris_get_mg_features_lev2.pro code is plotted. The red horizontal lines indicate the same area as in panel a). The short vertical lines in cyan indicate the time of the map in panel a), and panel d) shows a spectrum at that time (solid) and average quiet Sun spectrum (dotted). The dashed vertical lines denote the average position of the Mg ii k2 peaks. The right panel demonstrates the temporal evolution of the IRIS slit spectra at the slit location marked by the solid red horizontal line in panels a) to c) with the time of panel a) indicated again with lines in cyan.
Current usage metrics show cumulative count of Article Views (full-text article views including HTML views, PDF and ePub downloads, according to the available data) and Abstracts Views on Vision4Press platform.
Data correspond to usage on the plateform after 2015. The current usage metrics is available 48-96 hours after online publication and is updated daily on week days.
Initial download of the metrics may take a while.