Fig. 1
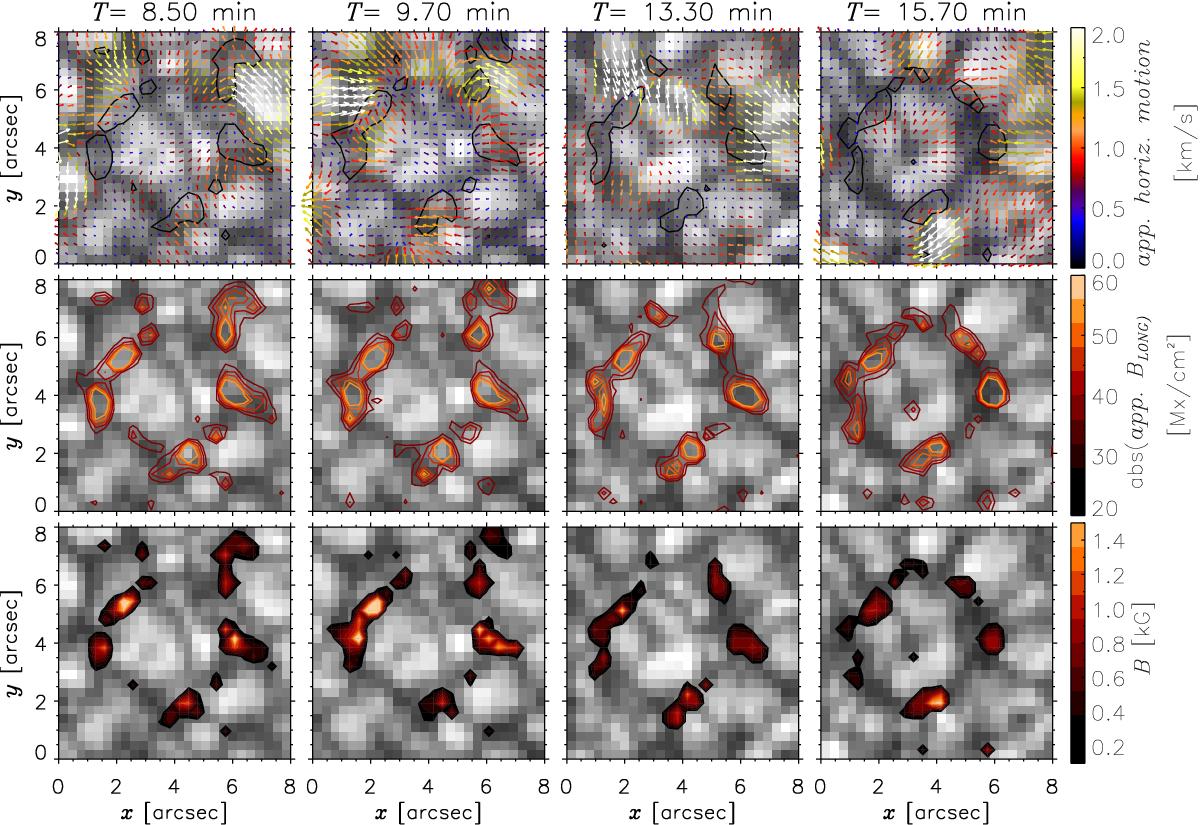
Rows, top to bottom: first row: Hinode SP continuum images with the 2D field of the apparent horizontal velocities calculated by the local correlation tracking (LCT) method shown with colored arrows. Black contours denote ![]() at ± 30 Mx cm-2 and the times above the panels refer to the IRIS time line. In the second row the continuum images are now overplotted by contours of the absolute of
at ± 30 Mx cm-2 and the times above the panels refer to the IRIS time line. In the second row the continuum images are now overplotted by contours of the absolute of ![]() magnetic flux density from absolute 20 Mx cm-2 to 60 Mx cm-2 in steps of 10 Mx cm-2. The last row shows the same continuum images now with filled contours of the magnetic field strength obtained from MERLIN inversions obtained with the default inversion parameters from http://www2.hao.ucar.edu/csac.
magnetic flux density from absolute 20 Mx cm-2 to 60 Mx cm-2 in steps of 10 Mx cm-2. The last row shows the same continuum images now with filled contours of the magnetic field strength obtained from MERLIN inversions obtained with the default inversion parameters from http://www2.hao.ucar.edu/csac.
Current usage metrics show cumulative count of Article Views (full-text article views including HTML views, PDF and ePub downloads, according to the available data) and Abstracts Views on Vision4Press platform.
Data correspond to usage on the plateform after 2015. The current usage metrics is available 48-96 hours after online publication and is updated daily on week days.
Initial download of the metrics may take a while.