Fig. 1
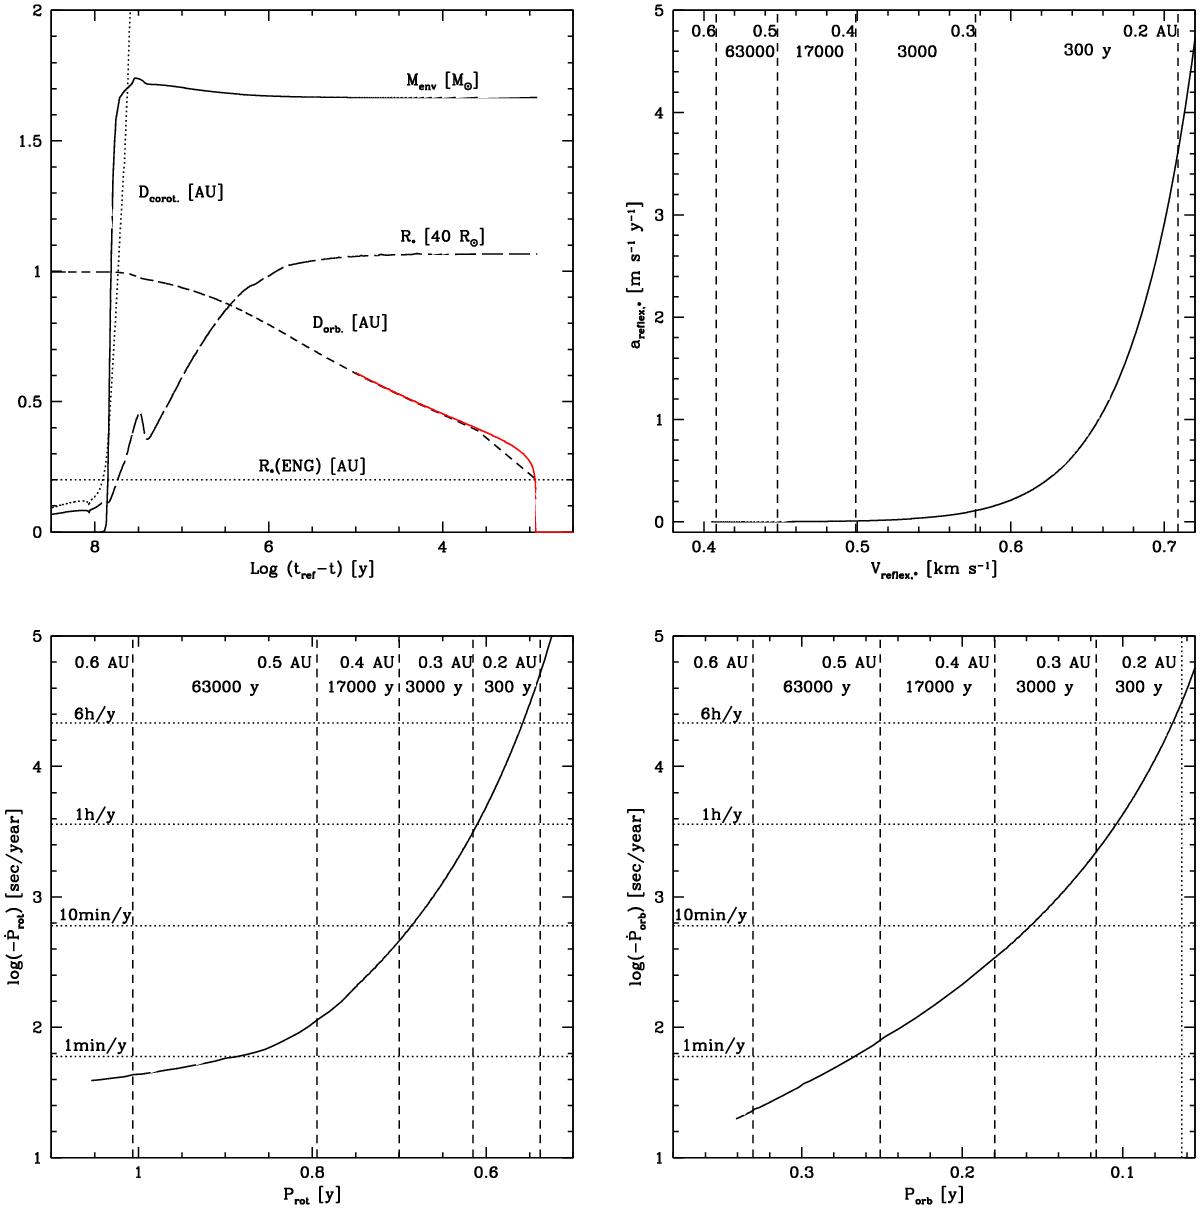
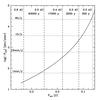
Upper left panel: evolution as a function of time of a few relevant quantities during the last 100 Myr before engulfment for a 15 MJ planet orbiting a 2 M⊙ star (Ωini/ Ωcrit = 0.1) at an initial distance equal to 1 au. The horizontal axis is the logarithm of the difference between a reference time (tref) taken here equal to 1.29018e+09 years and the age of the star. The short-dashed line labeled Dorb shows the evolution of the semi-major axis of the orbit of the planet in units of au. Superimposed to this short-dashed line, the analytical solutions to the orbit given by Eq. (3) is plotted as a red continuous line. The dotted line labeled Dcorot is the corotation radius. The continuous lines (Menv) and long-dashed line (R⋆) show the evolution of the mass (in M⊙) of the external convective envelope and of the radius of the star (in units of 40 R⊙). The horizontal dotted lines (R⋆(ENG)) is the radius of the star at engulfment in units of au. Upper right panel: acceleration of the reflex motion of the star as a function of the reflex motion of the star during the last 83 300 yr before planet engulfment. The vertical lines show the periods corresponding to different radii of the orbit. The dotted line on the right indicates the period just before engulfment (engulfment occurs when the radius of the orbit is equal to the stellar radius, which is 0.2 au). The times in years correspond to the durations for passing from the orbit radius indicated to the left (see the labels of the vertical lines) to the radius indicated to the right of the times. Lower left panel: decrease of the stellar spin period as a function of the steallar spin period. Lower right panel: period variations during the planetary orbit-shrinking as a function of the orbital period.
Current usage metrics show cumulative count of Article Views (full-text article views including HTML views, PDF and ePub downloads, according to the available data) and Abstracts Views on Vision4Press platform.
Data correspond to usage on the plateform after 2015. The current usage metrics is available 48-96 hours after online publication and is updated daily on week days.
Initial download of the metrics may take a while.