Fig. 3
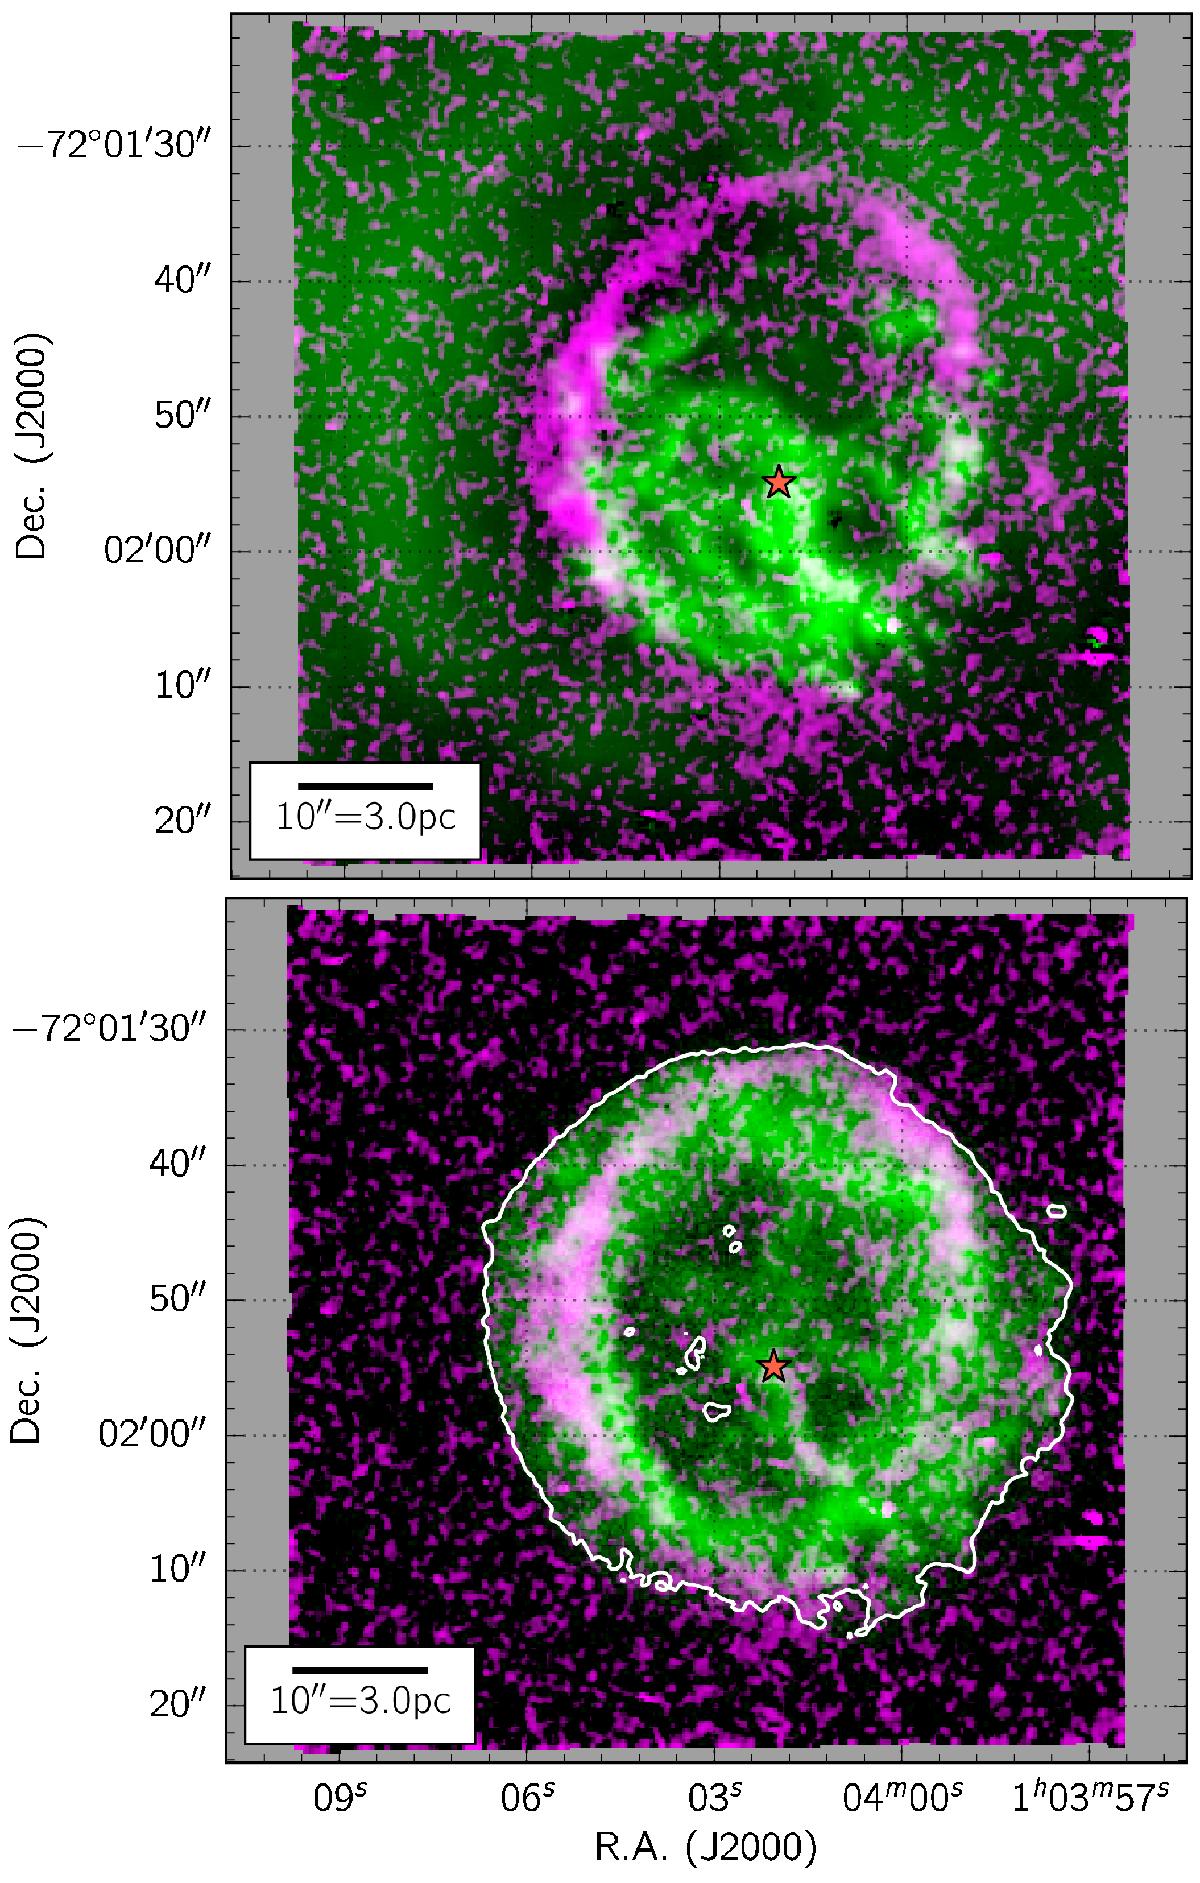
Top: comparison between the integrated [Fe XIV] emission (purple) and integrated [O III] λλ4959, 5007 Å emission (green). The red star marks the proper motion center of the O-rich ejecta derived by Finkelstein et al. (2006). Bottom: idem, but with the Chandra ACIS 1.1 → 2 keV X-ray flux instead (ACIS image credits: NASA/CXC/MIT/D. Dewey et al., and NASA/CXC/SAO/J. DePasquale). The full extent of the X-ray shell is traced with a white contour.
Current usage metrics show cumulative count of Article Views (full-text article views including HTML views, PDF and ePub downloads, according to the available data) and Abstracts Views on Vision4Press platform.
Data correspond to usage on the plateform after 2015. The current usage metrics is available 48-96 hours after online publication and is updated daily on week days.
Initial download of the metrics may take a while.