Fig. 1
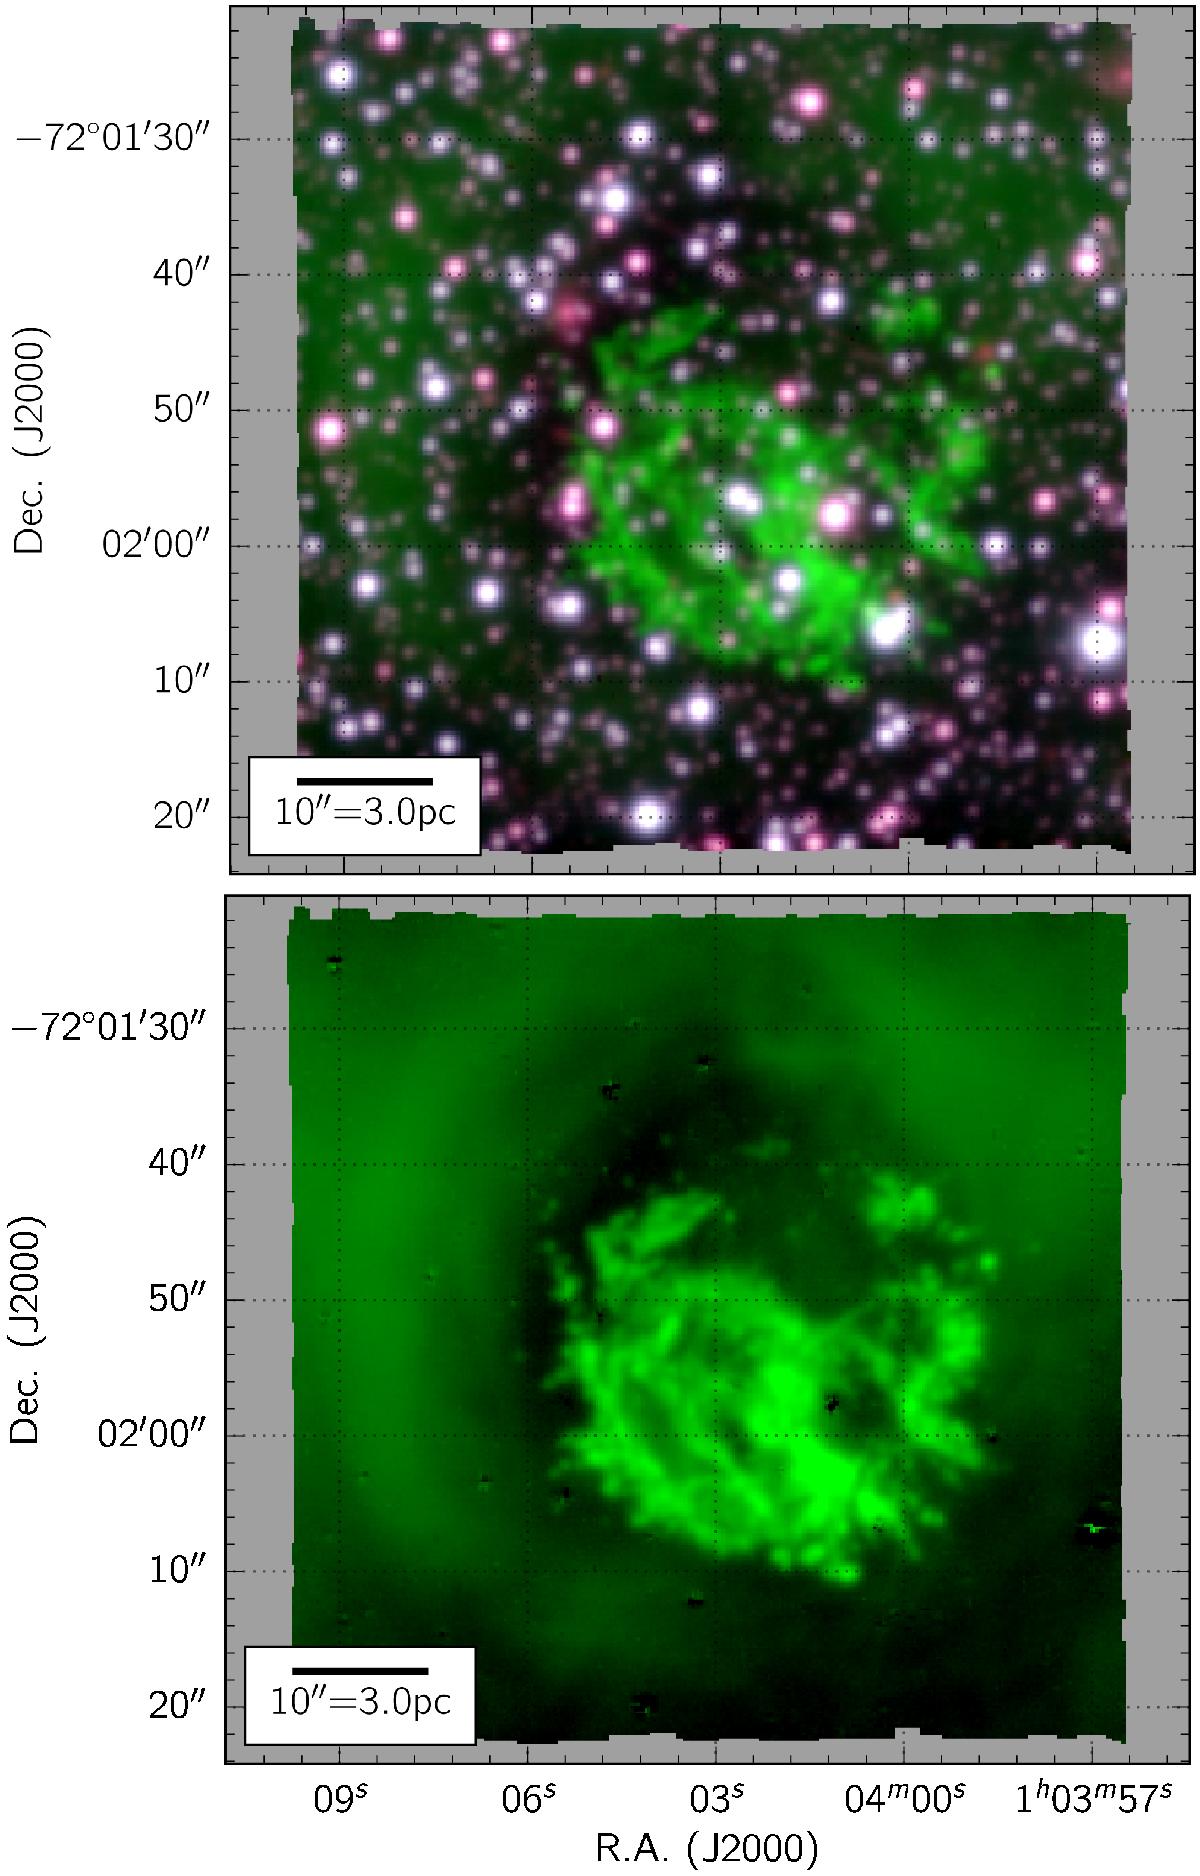
Pseudo-RGB images constructed from the combined MUSE datacube before (top) and after (bottom) removing the stellar and nebular continuum in each spaxel, with the R, G, and B channels corresponding to the summed 6900 Å → 7100 Å, 4900 Å → 5100 Å, and 5300 Å → 5500 Å (observed) spectral ranges, respectively. The intensity stretch of each channel differs between both images for greater clarity. Stars appear in hues of blue and red, whereas the O-rich fast-moving ejecta are visible as bright green filaments.
Current usage metrics show cumulative count of Article Views (full-text article views including HTML views, PDF and ePub downloads, according to the available data) and Abstracts Views on Vision4Press platform.
Data correspond to usage on the plateform after 2015. The current usage metrics is available 48-96 hours after online publication and is updated daily on week days.
Initial download of the metrics may take a while.