Fig. 7
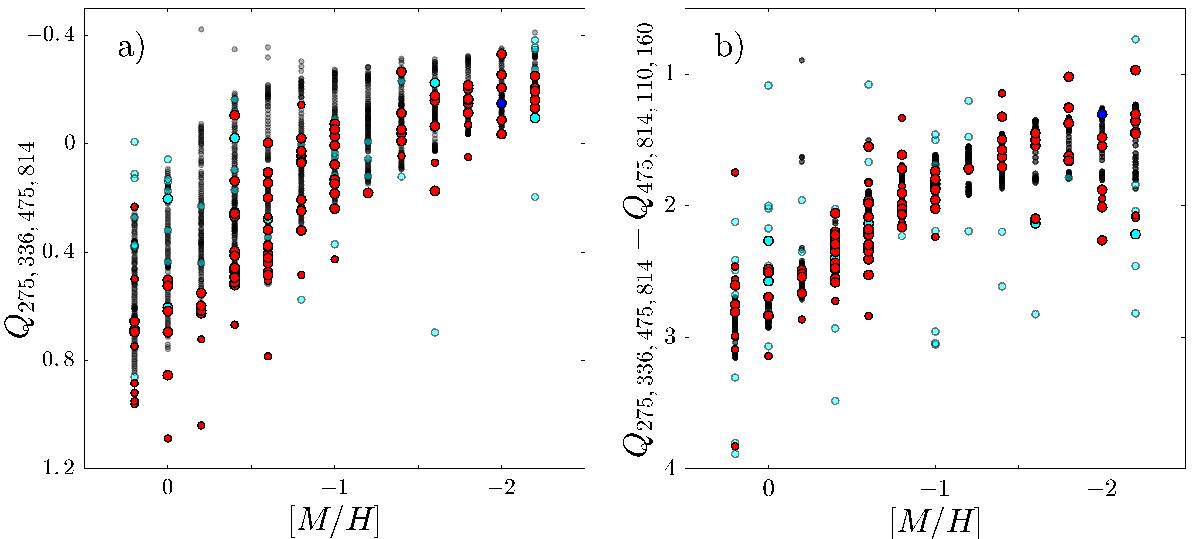
Q parameter (panel a)) and Q-Q parameters (panel b)) vs. metallicity diagrams for clusters with age derived beyond 1 Gyr. The clusters are colour-coded according to their type, as in Fig. 6. Large dots are for group 1 while small dots are for group 2 clusters. Black dots are SSP models with age extending from 1 Gyr to 13 Gyr, downwards in panel a) and upwards in panel b)).
Current usage metrics show cumulative count of Article Views (full-text article views including HTML views, PDF and ePub downloads, according to the available data) and Abstracts Views on Vision4Press platform.
Data correspond to usage on the plateform after 2015. The current usage metrics is available 48-96 hours after online publication and is updated daily on week days.
Initial download of the metrics may take a while.