Fig. 4
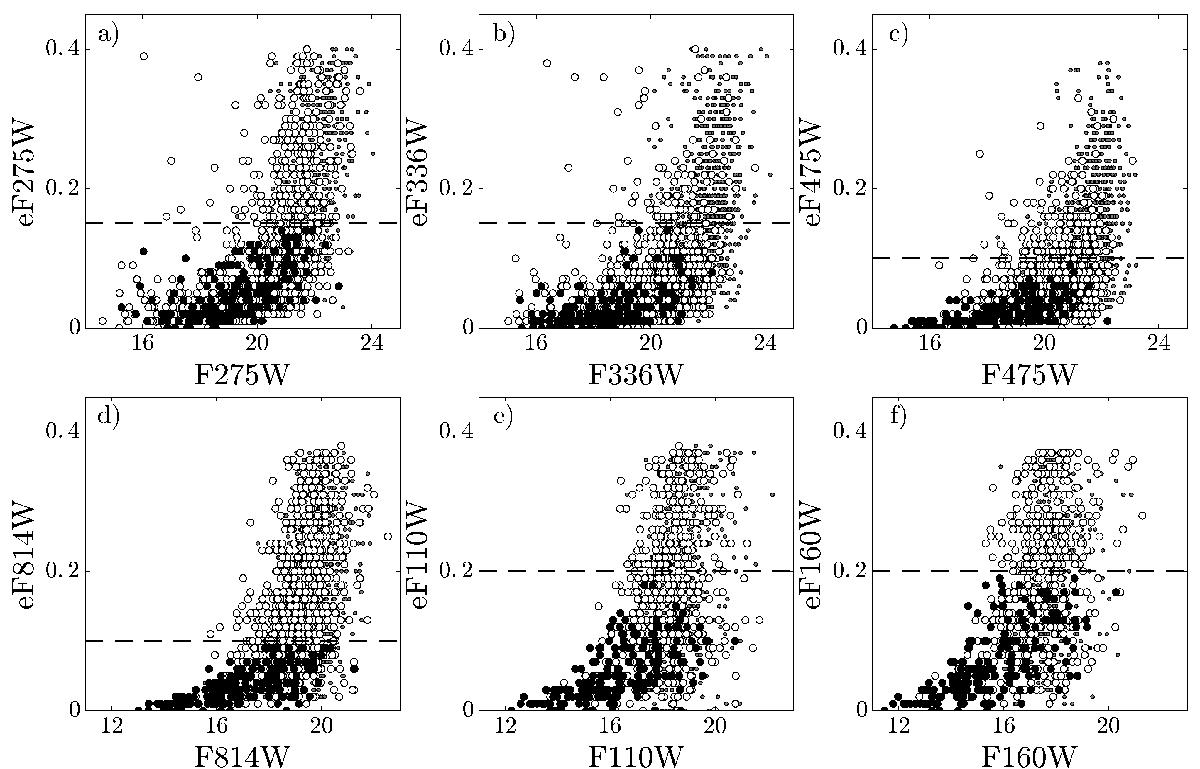
Photometric accuracy of the studied sample of star clusters from the Johnson et al. (2015) catalogue. The small grey dots mark the clusters rejected during the visual classification (see text) and not studied in the following analysis. Group 1 clusters (181 objects, large filled dots) have upper limits of the photometric errors indicated by long dashed lines in different filters. Group 2 clusters (1182 objects, large open dots) have photometric errors larger than these limits in at least one filter.
Current usage metrics show cumulative count of Article Views (full-text article views including HTML views, PDF and ePub downloads, according to the available data) and Abstracts Views on Vision4Press platform.
Data correspond to usage on the plateform after 2015. The current usage metrics is available 48-96 hours after online publication and is updated daily on week days.
Initial download of the metrics may take a while.