Fig. 3
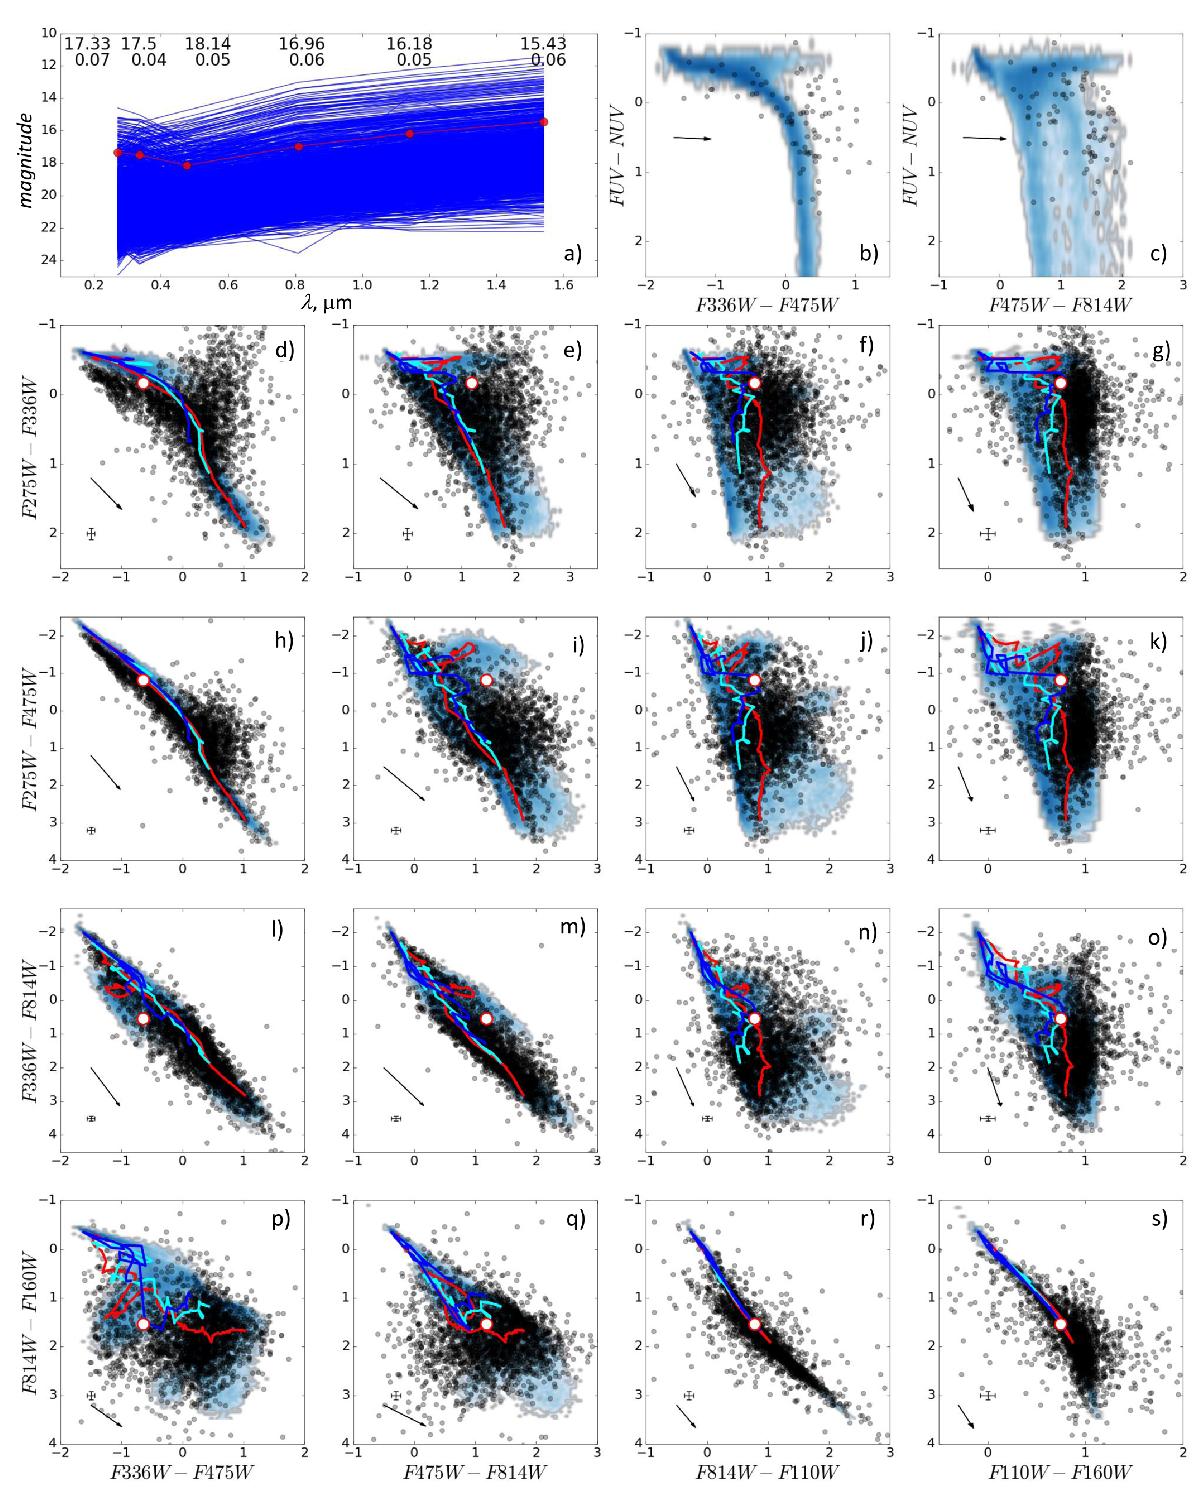
Photometric diagrams of the cluster ID27 (large white dot). Panel a) shows the WFC+ACS passband magnitudes (in red) of the cluster ID27 compared to all other clusters from the catalogue (in blue) vs. wavelength. Magnitudes and their uncertainties are indicated in the upper part of the panel. Panels b) and c) show the GALEX FUV-NUV colour vs. WFC3+ACS colours for clusters with available GALEX photometry from Kang et al. (2012). Panels (d)–s)) show colour-colour diagrams in WFC3+ACS passbands using the PHAT photometry. On y-axes (panels d), h), l), p)) and on x-axes (panels p), q), r), s)) colour combinations go from blue to red. In each colour–colour diagram 3 SSP (single stellar population) lines for solar ([ M / H ] = 0, red), intermediate ([ M / H ] = −1, cyan), and poor ([ M / H ] = −2, blue) metallicities are shown. Arrows indicate extinction vectors corresponding to AV = 1. Error bars indicate observation errors of colours.
Current usage metrics show cumulative count of Article Views (full-text article views including HTML views, PDF and ePub downloads, according to the available data) and Abstracts Views on Vision4Press platform.
Data correspond to usage on the plateform after 2015. The current usage metrics is available 48-96 hours after online publication and is updated daily on week days.
Initial download of the metrics may take a while.