Fig. 2
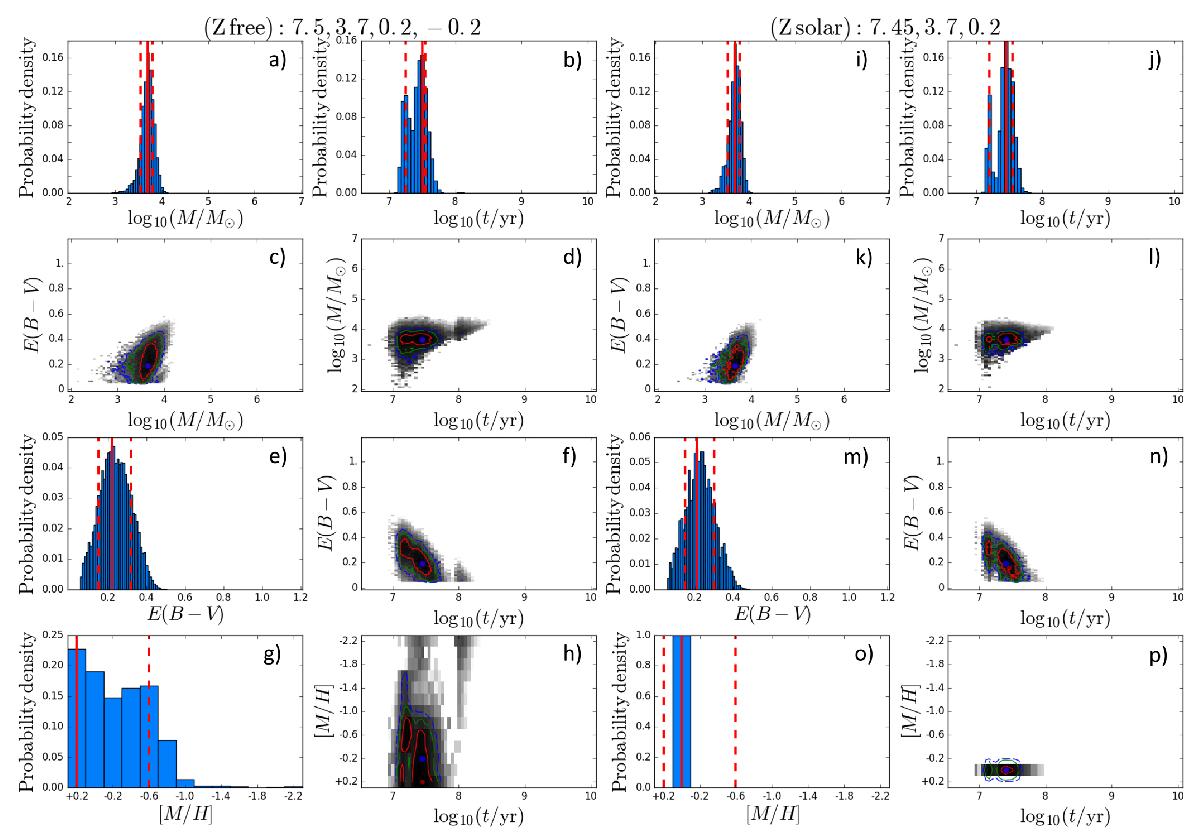
Diagrams with classification results of the cluster ID27 in free (panels a)–h)) and in fixed solar metallicity (panels i)–p)) cases. The maximum likelihood in 4D parameter space is indicated in the 2D likelihood maps (panels c), d), f), h), k), l), n), p)) by a blue dot, and is surrounded by contours enclosing the 99% (blue line), 95% (green line), and 68% (red line) likelihood levels.
Current usage metrics show cumulative count of Article Views (full-text article views including HTML views, PDF and ePub downloads, according to the available data) and Abstracts Views on Vision4Press platform.
Data correspond to usage on the plateform after 2015. The current usage metrics is available 48-96 hours after online publication and is updated daily on week days.
Initial download of the metrics may take a while.