Fig. 10
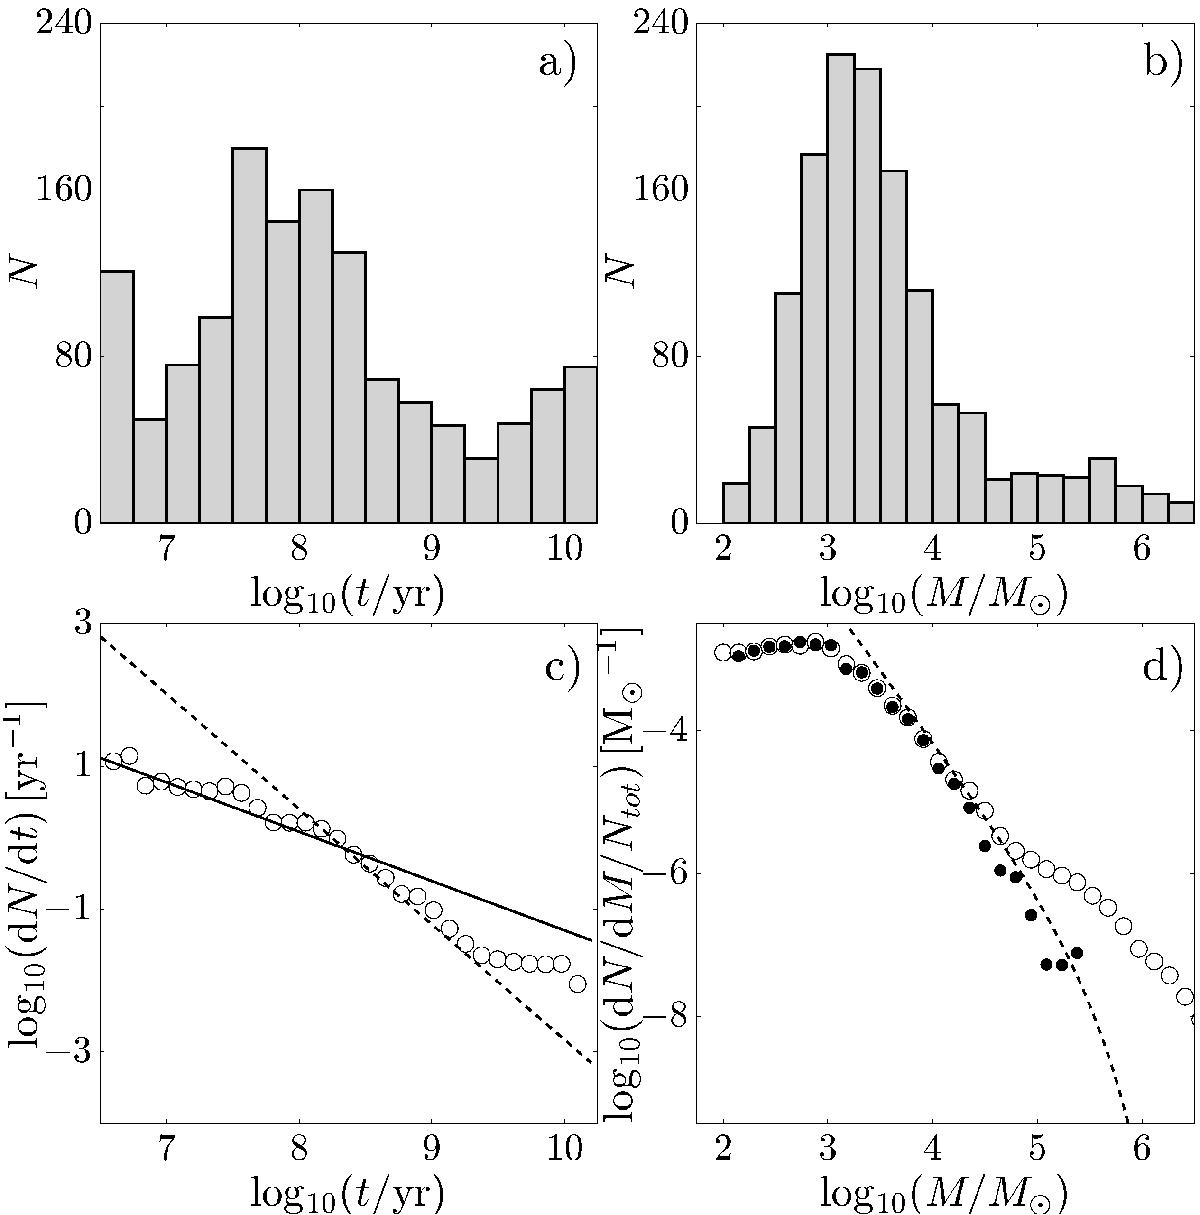
Properties of the star-cluster sample. Top panels show age (panel a)) and mass (panel b)) distributions of the studied clusters. Bottom panels show age (panel c)) and mass (panel d)) differential distributions. In panel c) the mass is truncated to log 10(M/M⊙) = 3. In panel d) open dots represent mass function for all clusters, while filled dots represent mass function for clusters younger than 3 Gyr, to exclude massive globular-like clusters.
Current usage metrics show cumulative count of Article Views (full-text article views including HTML views, PDF and ePub downloads, according to the available data) and Abstracts Views on Vision4Press platform.
Data correspond to usage on the plateform after 2015. The current usage metrics is available 48-96 hours after online publication and is updated daily on week days.
Initial download of the metrics may take a while.