Fig. 2
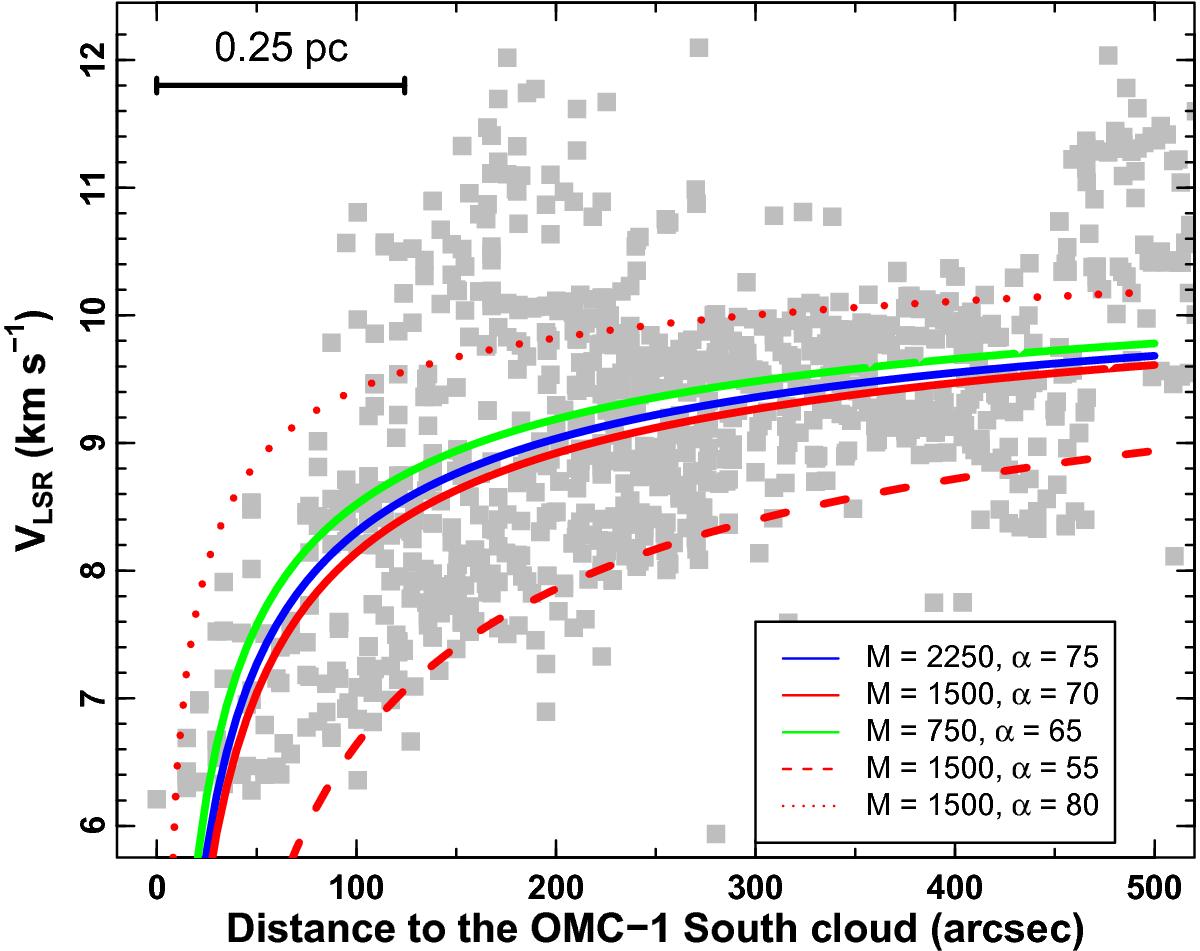
Gas velocity structure as a function of the distance to the OMC-1 South cloud for all the gas components detected with S/N ≥ 3 (gray squares). Different lines describe the expected velocity profile for a free-falling particle in a series of potential wells with different masses M observed at different angles α following Eq. (1) (see parameters in the lower right corner; masses are in M⊙ and angles are in degrees).
Current usage metrics show cumulative count of Article Views (full-text article views including HTML views, PDF and ePub downloads, according to the available data) and Abstracts Views on Vision4Press platform.
Data correspond to usage on the plateform after 2015. The current usage metrics is available 48-96 hours after online publication and is updated daily on week days.
Initial download of the metrics may take a while.