Fig. 1
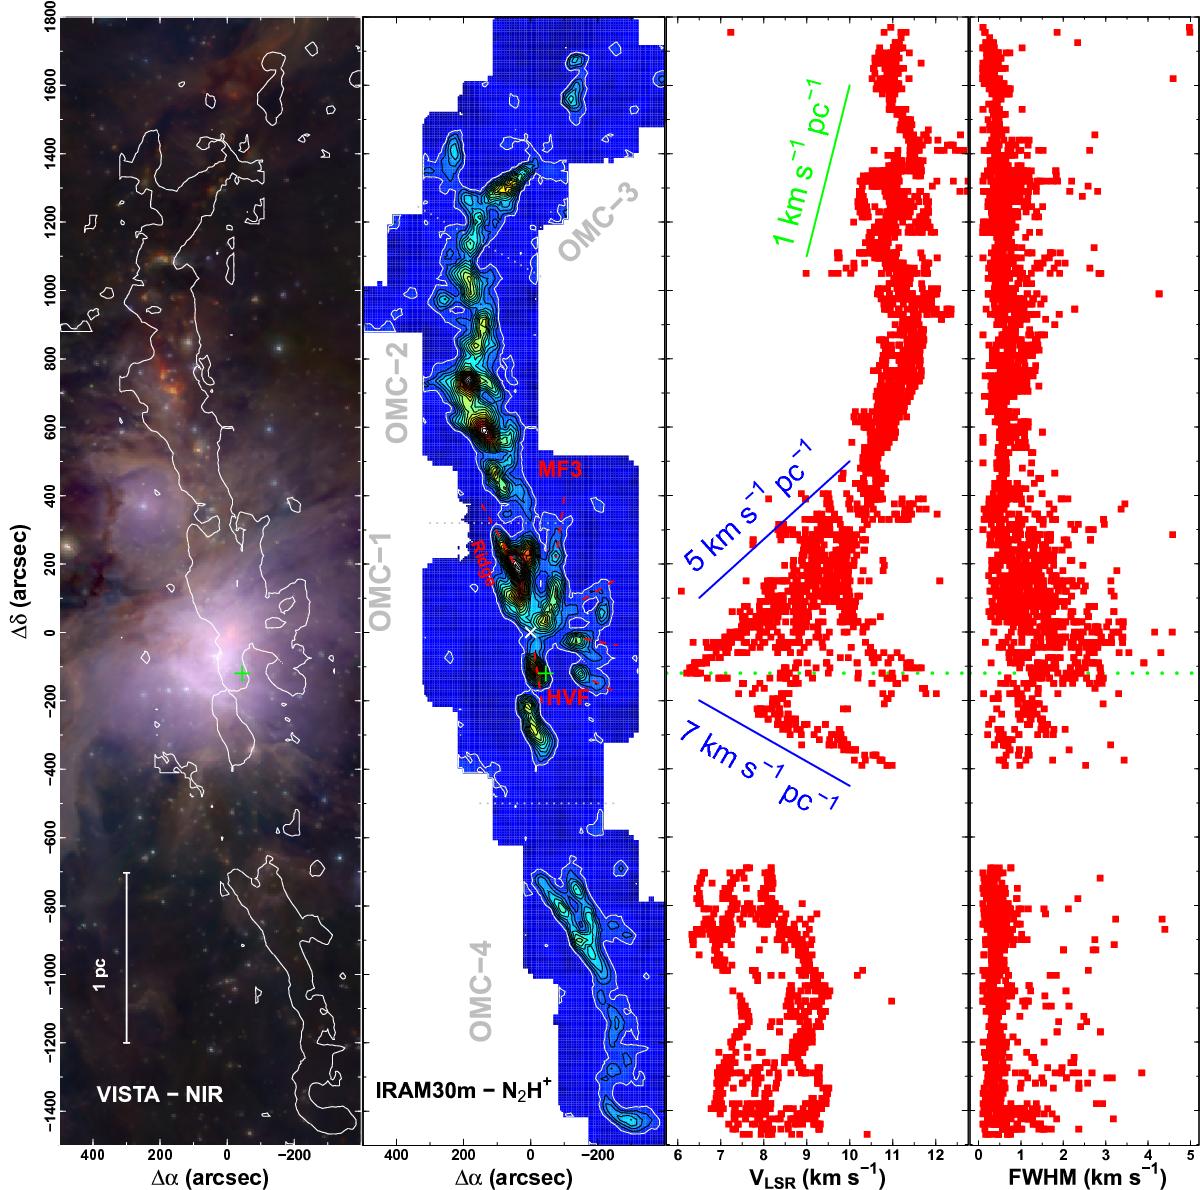
From left to right: a) VISTA-NIR image of the ISF (Meingast et al. 2016); b) IRAM 30 m integrated N2H+ (1−0) emission; c) N2H+ line velocity centroid (VLSR) and d) N2H+ Full-Width-Half-Maximum (FWHM) as a function of declination. Map offsets are referred, in radio projection, to the position of the Orion BN source ![]() (white cross). N2H+ contours are equally spaced every 2 K km s-1. For reference, the first N2H+ contour is superposed to the IR image. The location of the most prominent molecular fingers (e.g., the OMC-1 ridge, MF3, and HVF; Rodriguez-Franco et al. 1992) are indicated by red lines in the integrated intensity map. The magnitude of representative gradients with 1 (green) plus 5, and 7 (blue) km s-1 pc-1 are indicated in the velocity plot. The position of the OMC-1 South clump with the most blue-shifted velocity is indicated in both maps (green cross) and kinematic plots (green dashed line).
(white cross). N2H+ contours are equally spaced every 2 K km s-1. For reference, the first N2H+ contour is superposed to the IR image. The location of the most prominent molecular fingers (e.g., the OMC-1 ridge, MF3, and HVF; Rodriguez-Franco et al. 1992) are indicated by red lines in the integrated intensity map. The magnitude of representative gradients with 1 (green) plus 5, and 7 (blue) km s-1 pc-1 are indicated in the velocity plot. The position of the OMC-1 South clump with the most blue-shifted velocity is indicated in both maps (green cross) and kinematic plots (green dashed line).
Current usage metrics show cumulative count of Article Views (full-text article views including HTML views, PDF and ePub downloads, according to the available data) and Abstracts Views on Vision4Press platform.
Data correspond to usage on the plateform after 2015. The current usage metrics is available 48-96 hours after online publication and is updated daily on week days.
Initial download of the metrics may take a while.