Fig. 6
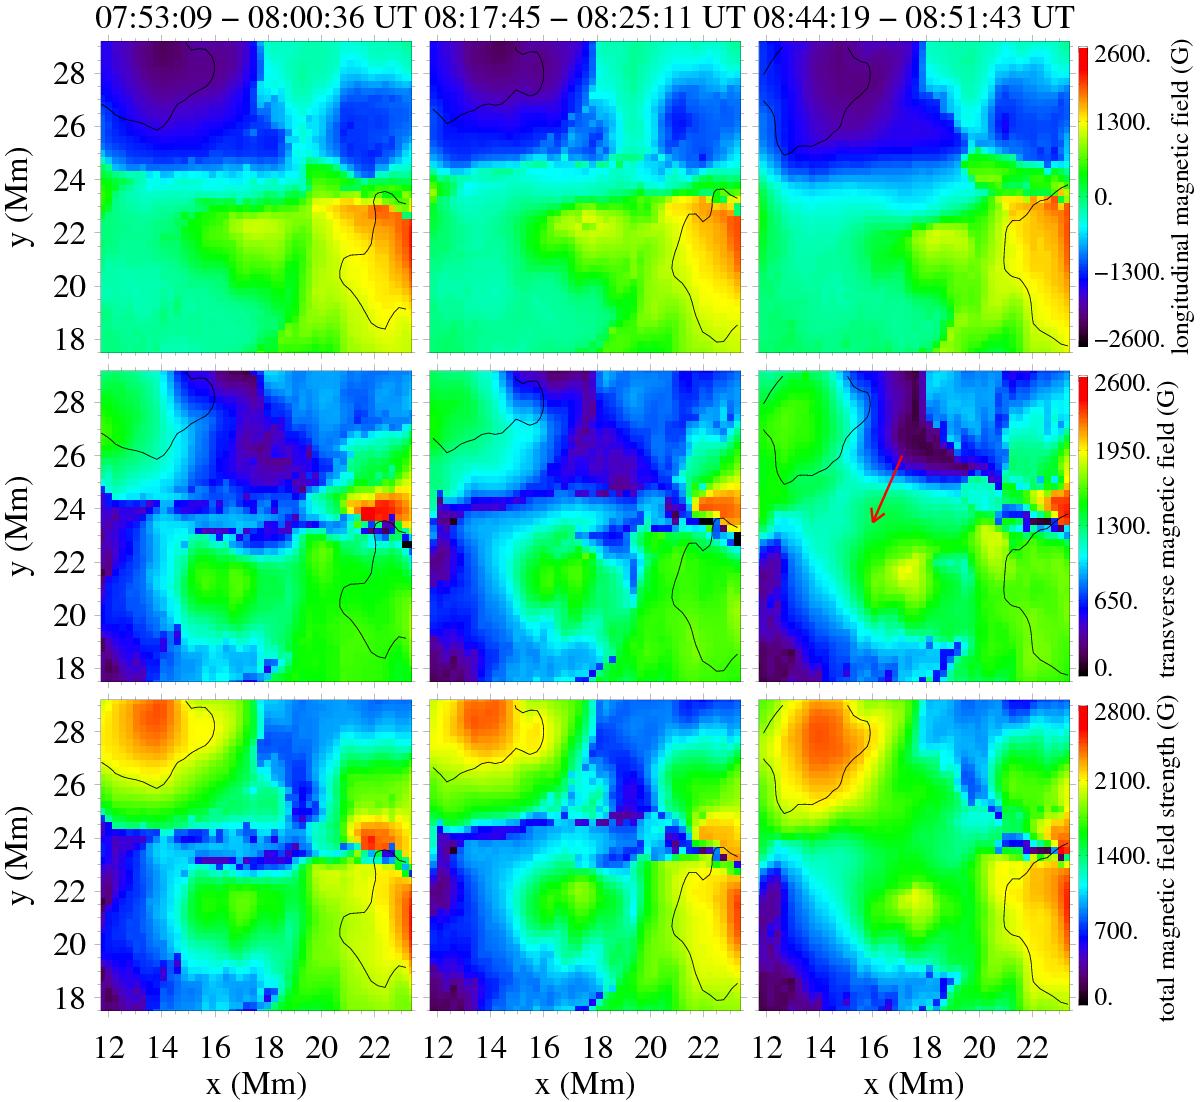
From top to bottom: longitudinal, transverse, and total magnetic field strength inferred from the Fe i 10783 Å inversions. Cutouts from scans 1, 2, and 3 showing internal area of the δ-spot related to the observed changes of the magnetic field are displayed from left to right. The axes in Mm are used in order to allow easier verification of determined parameters listed in the text (e.g., values entering Eq. (1)). The red arrow marks an enhanced patch of transverse magnetic field detected in scan 3 (i.e., during the M-class flare). The black lines represent umbrae of the δ-spot.
Current usage metrics show cumulative count of Article Views (full-text article views including HTML views, PDF and ePub downloads, according to the available data) and Abstracts Views on Vision4Press platform.
Data correspond to usage on the plateform after 2015. The current usage metrics is available 48-96 hours after online publication and is updated daily on week days.
Initial download of the metrics may take a while.