Fig. 5
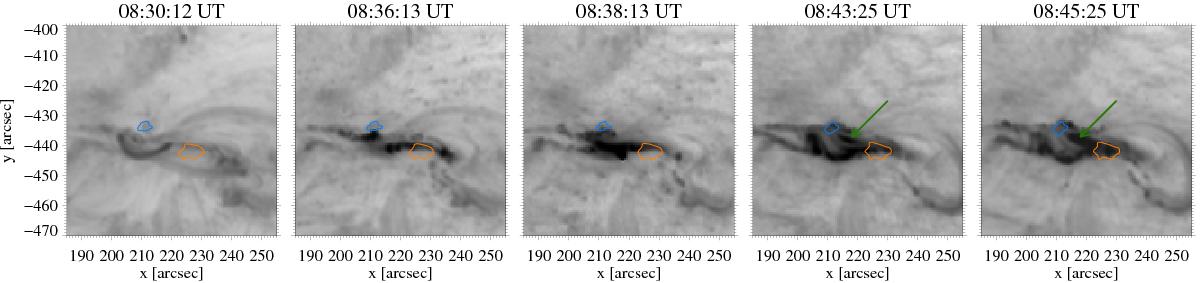
AIA 171 Å filtergrams at five different times showing temporal changes of coronal structures during the observed M-class flare. In particular, the images show the temporal evolution of flare loops (marked by the green arrows) which connect the umbrae within the δ-spot. This feature was not visible before, during the impulsive phase and the peak time of the flare (first three panels) but appeared shortly after the flare’s X-ray flux reached its maximum (last two panels). The logarithmic scale and a reversed intensity scaling is used again. The times above each panel correspond to the midpoint of the particular recording time. The contours have the same meaning as in Fig. 4. The full time resolution animation at this wavelength is also available as a part of the online movie.
Current usage metrics show cumulative count of Article Views (full-text article views including HTML views, PDF and ePub downloads, according to the available data) and Abstracts Views on Vision4Press platform.
Data correspond to usage on the plateform after 2015. The current usage metrics is available 48-96 hours after online publication and is updated daily on week days.
Initial download of the metrics may take a while.