Fig. 4
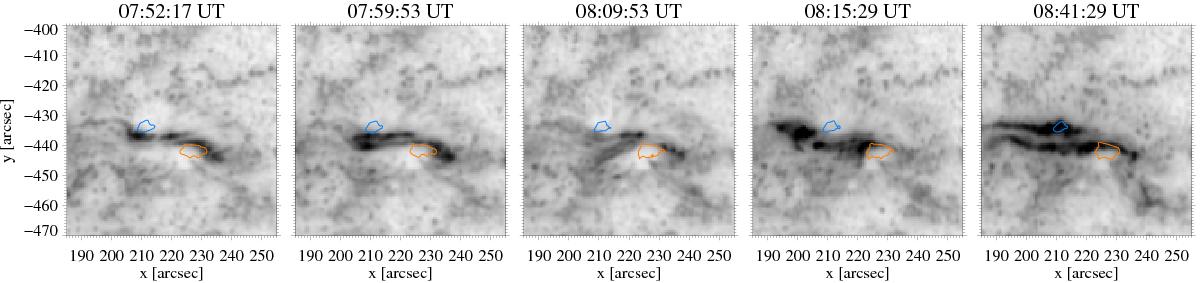
Sequence of AIA 1600 Å filtergrams showing almost continuous flaring activity within the δ-spot of the AR 11865 during observations. The logarithmic scale and a reversed intensity scaling is used to display the data. The midpoint of the recording time of the particular images is presented above each panel. The light-blue and orange contours represent the umbrae of negative and positive polarity within the spot, respectively. The full time resolution animation of the displayed wavelength channel is shown in the online movie.
Current usage metrics show cumulative count of Article Views (full-text article views including HTML views, PDF and ePub downloads, according to the available data) and Abstracts Views on Vision4Press platform.
Data correspond to usage on the plateform after 2015. The current usage metrics is available 48-96 hours after online publication and is updated daily on week days.
Initial download of the metrics may take a while.