Fig. 1
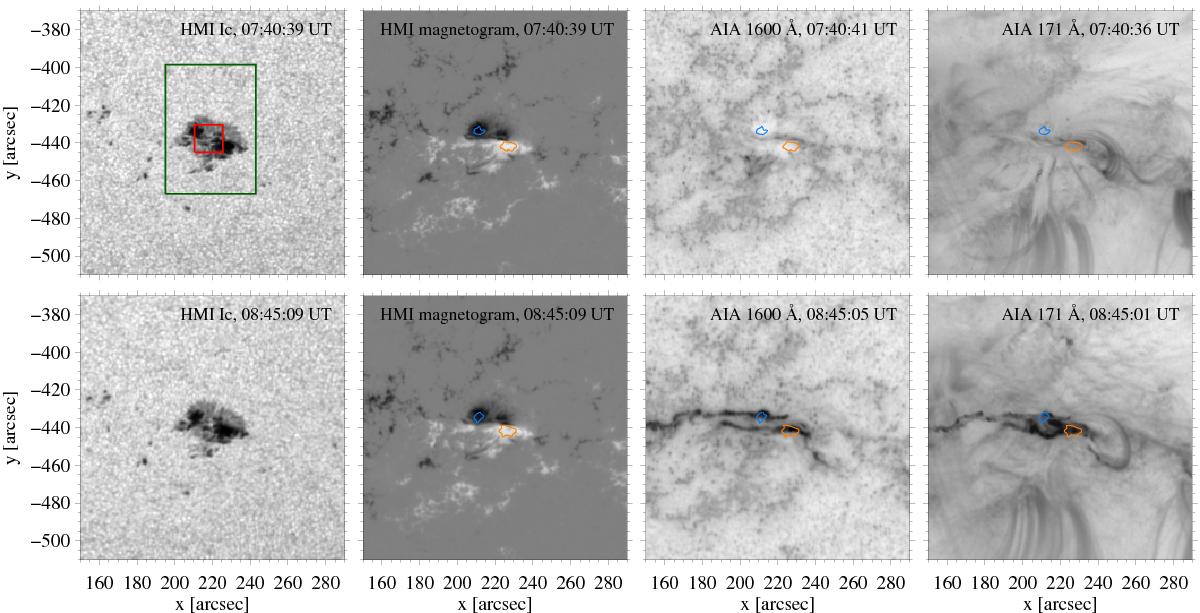
Overview images showing AR 11865 shortly before (top panels) and during (bottom panels) observations. The first two panels of each row show the HMI continuum intensity and line-of-sight magnetic field (values are clipped at ±1500 G), respectively. The last two panels are AIA filtergrams taken in the 1600 Å and 171 Å channels. They are displayed on logarithmic scale and a reversed intensity scaling is used. The times listed in the upper right corner of each panel correspond to the midpoint of the particular HMI or AIA exposure time. The light-blue and orange contours represent the umbrae of opposite polarity within the δ-spot. The green rectangle outlines the full field-of-view of the TIP-II instrument. The red square shows the area displayed in Figs. 6, 7, and 9.
Current usage metrics show cumulative count of Article Views (full-text article views including HTML views, PDF and ePub downloads, according to the available data) and Abstracts Views on Vision4Press platform.
Data correspond to usage on the plateform after 2015. The current usage metrics is available 48-96 hours after online publication and is updated daily on week days.
Initial download of the metrics may take a while.