Free Access
Fig. 8
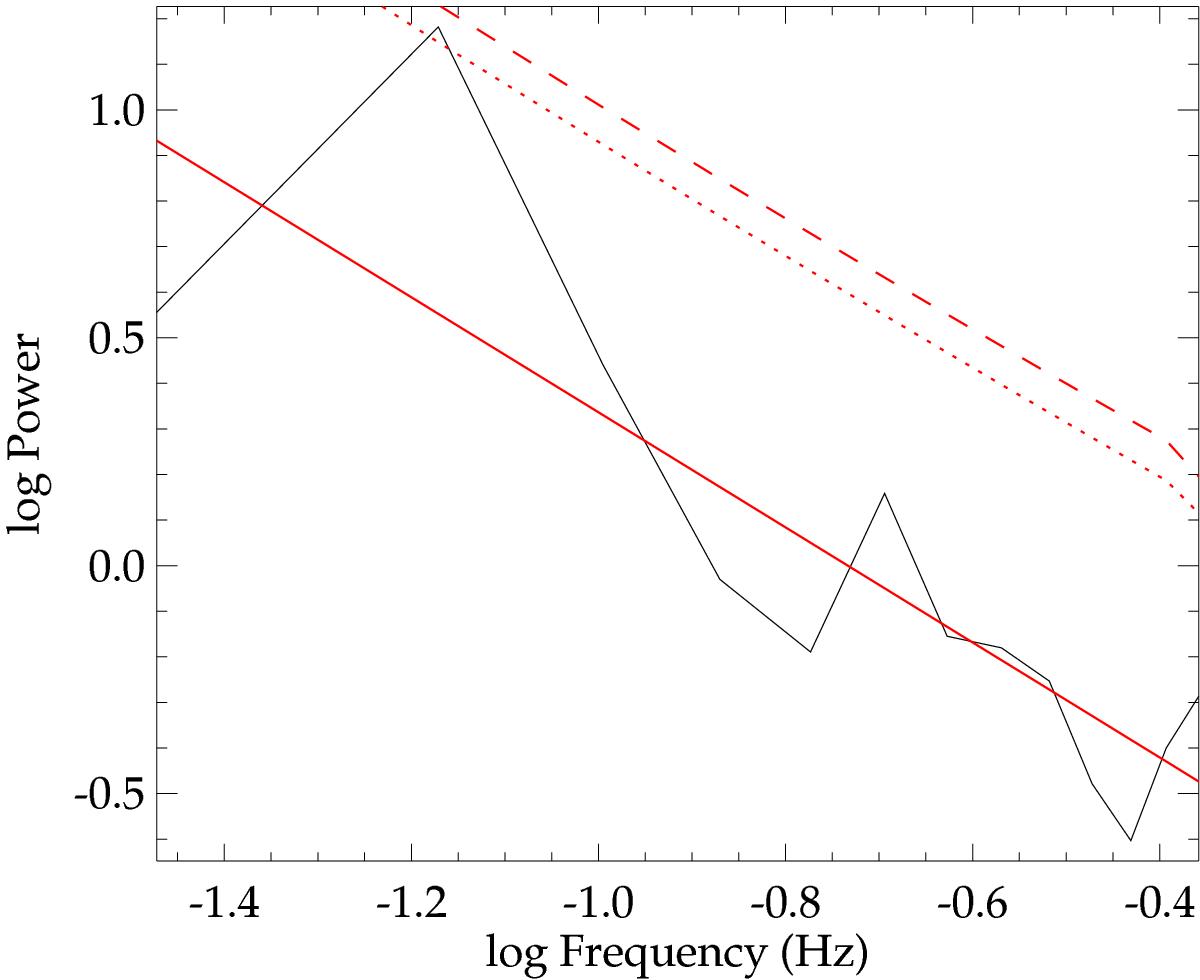
Rebinned power spectrum for the flare shown in Fig. 7. The peak at a period of ![]() s now surpasses the 95% confidence level, which is shown by the red dotted line.
s now surpasses the 95% confidence level, which is shown by the red dotted line.
Current usage metrics show cumulative count of Article Views (full-text article views including HTML views, PDF and ePub downloads, according to the available data) and Abstracts Views on Vision4Press platform.
Data correspond to usage on the plateform after 2015. The current usage metrics is available 48-96 hours after online publication and is updated daily on week days.
Initial download of the metrics may take a while.