Fig. 4
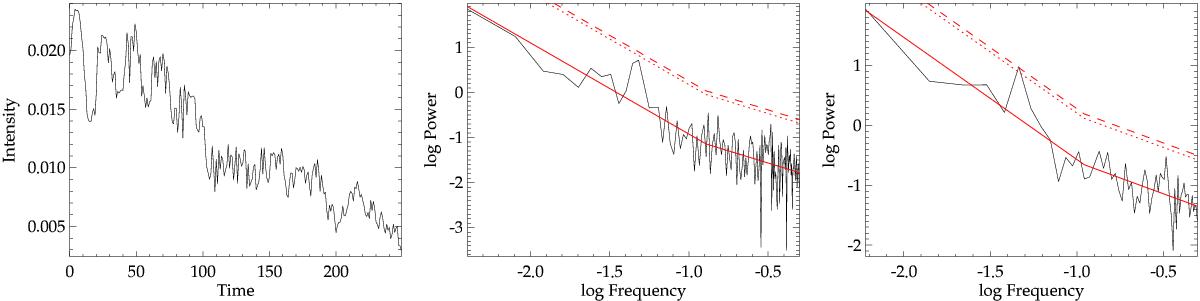
Example of how rebinning can help spectral peaks corresponding to certain kinds of periodic signals reach a significant power level. The left panel shows a synthetic time series signal, similar to that in the top left panel of Fig. 3, but with a sinusoidal component that has a frequency that fluctuates slightly with time. The middle panel shows the corresponding power spectrum, and the right panel shows the rebinned power spectrum (after summing the powers in every two frequency bins). As before, the red solid line is a power law fit, and the red dotted and dashed lines correspond to the 95% and 99% confidence levels respectively.
Current usage metrics show cumulative count of Article Views (full-text article views including HTML views, PDF and ePub downloads, according to the available data) and Abstracts Views on Vision4Press platform.
Data correspond to usage on the plateform after 2015. The current usage metrics is available 48-96 hours after online publication and is updated daily on week days.
Initial download of the metrics may take a while.