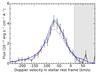
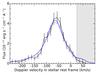
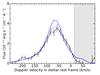
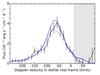
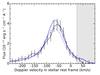
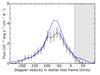
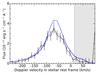
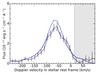
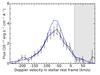
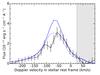
Fig. A.3
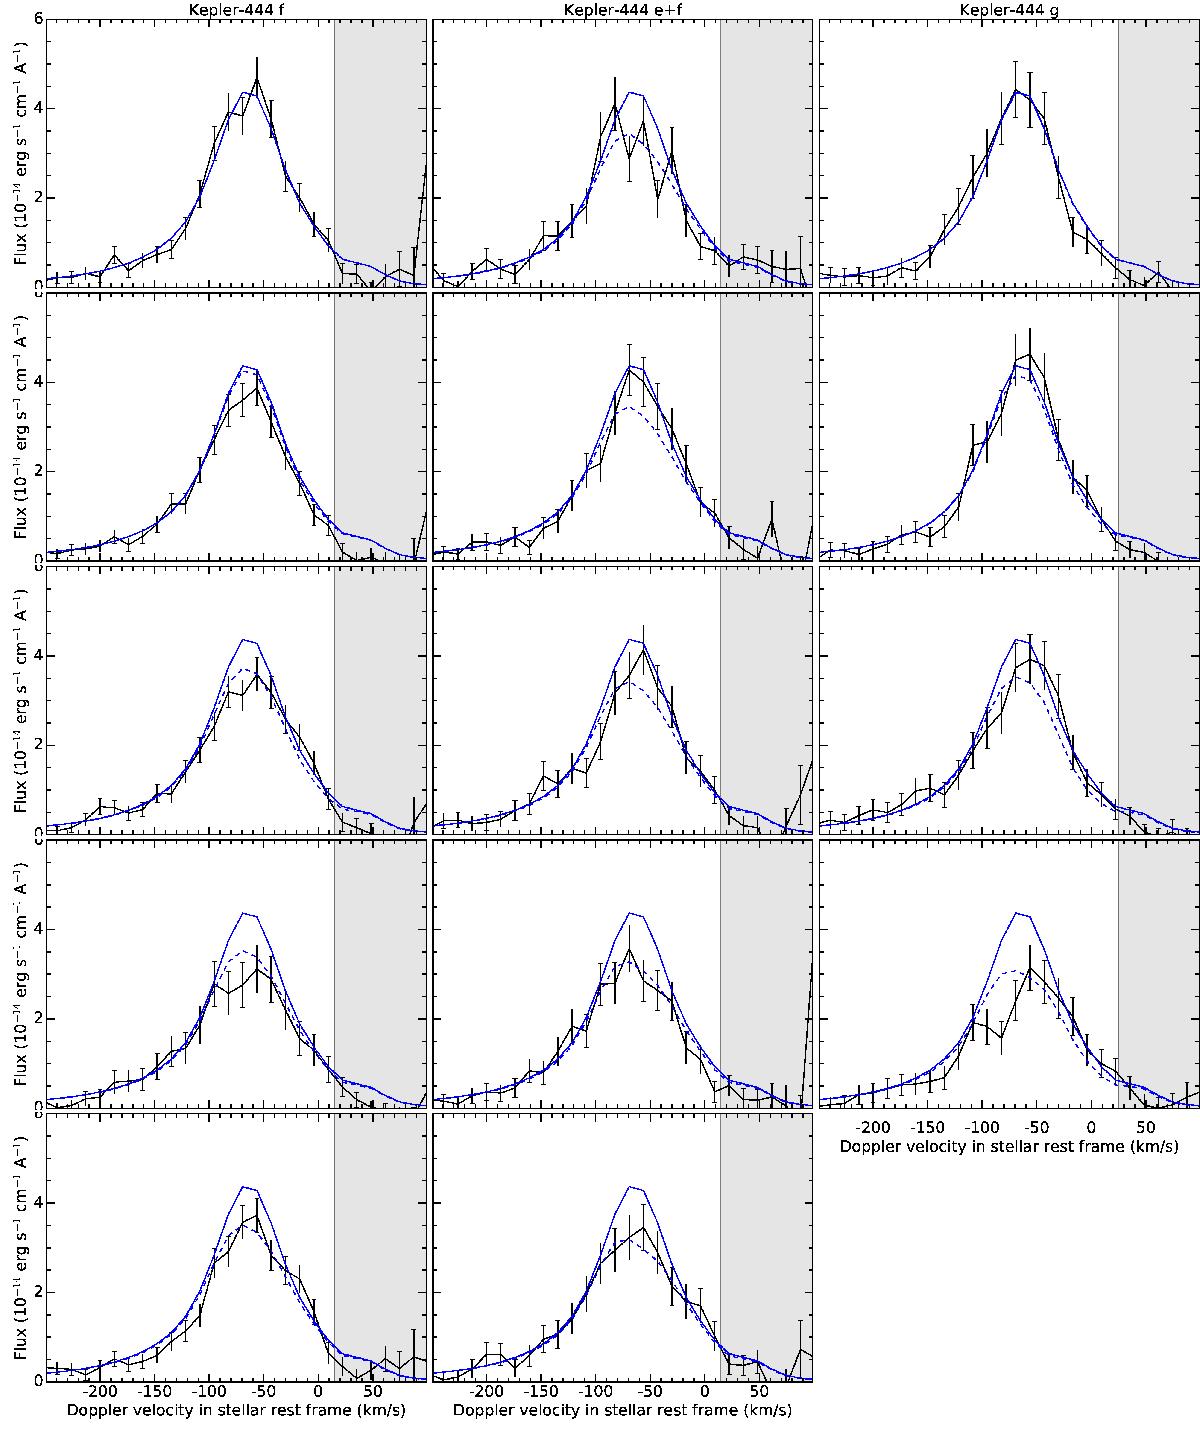
Kepler-444 spectra associated with the light-curves in Figs. 3 and 6. The first column corresponds to the transits of Kepler-444f in Visits B, C, and F. The second column corresponds to the transit of Kepler-444e in Visit A. The third column corresponds to the inferior conjunction of the hypothetical Kepler-444g in Visit E. In the first and second rows, the spectra have been averaged over common phase windows after being phased over Kepler-444f ephemeris. The solid blue line is the reconstructed out-of-transit stellar line. The dashed blue line corresponds to simulations that provide a reasonable fit to the data in this scenario. The shaded gray area was excluded from the fits.


Current usage metrics show cumulative count of Article Views (full-text article views including HTML views, PDF and ePub downloads, according to the available data) and Abstracts Views on Vision4Press platform.
Data correspond to usage on the plateform after 2015. The current usage metrics is available 48-96 hours after online publication and is updated daily on week days.
Initial download of the metrics may take a while.