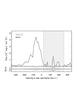
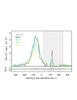
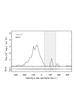
Fig. A.2
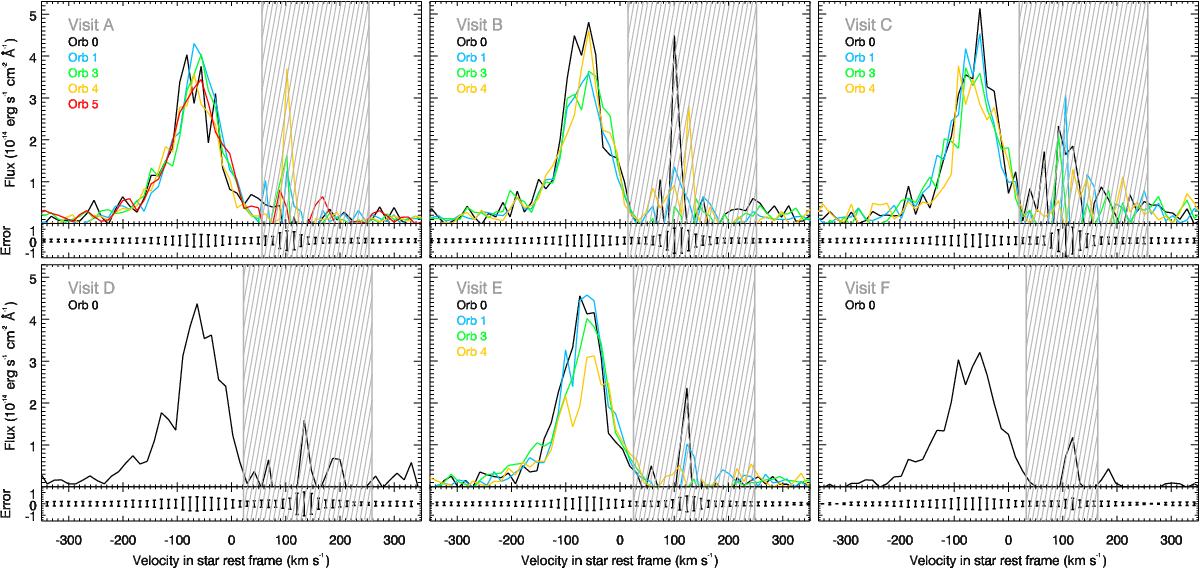
Measurements of Kepler-444 Ly-α line during each HST visit. We show the spectra gathered over the full HST orbits, and plotted as a function of Doppler velocity in the stellar rest frame. Subpanels display error bars typical of a full-orbit spectrum in each visit. The shaded gray area corresponds to the range affected by ISM absorption and geocoronal emission.
Current usage metrics show cumulative count of Article Views (full-text article views including HTML views, PDF and ePub downloads, according to the available data) and Abstracts Views on Vision4Press platform.
Data correspond to usage on the plateform after 2015. The current usage metrics is available 48-96 hours after online publication and is updated daily on week days.
Initial download of the metrics may take a while.