Fig. 6
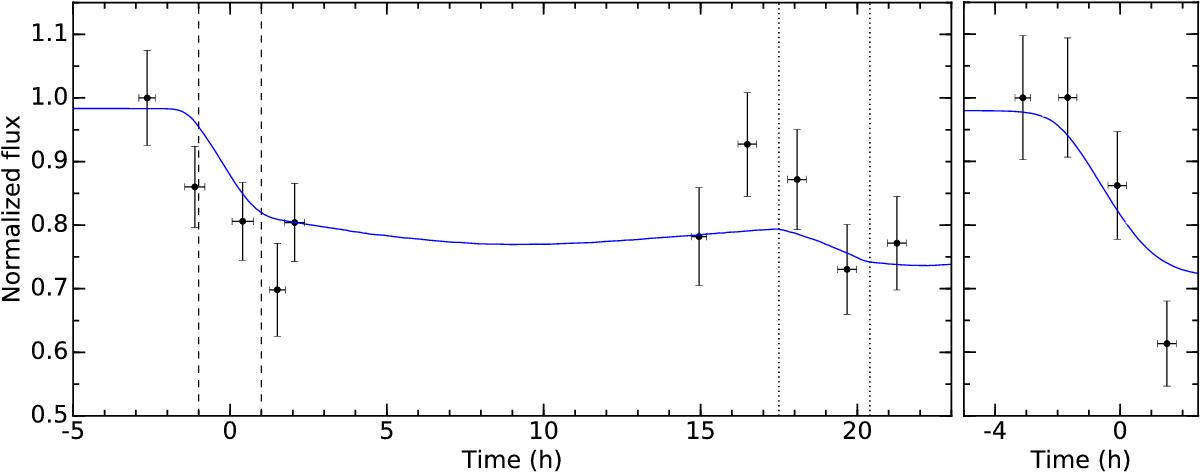
Transit light curve in the Ly-α line for Kepler-444 e+f (left panel) and Kepler-444 g (right panel). In the left panel, spectra in Visits A, B, C, and F have been averaged over common phase windows after being phased over Kepler-444 f ephemeris, and integrated in the range [−89; −37] km s-1 (see first and second columns in Fig. A.3). In the right panel, spectra in Visit E have been integrated in the range [−103; −37] km s-1 (see third column in Fig. A.3). In blue are plotted the theoretical transit light curves of the planets’ exospheres, subjected to a low photoionization and radiation pressure, and to interactions with the stellar wind. They were fitted independently to the data in the left and right panels.
Current usage metrics show cumulative count of Article Views (full-text article views including HTML views, PDF and ePub downloads, according to the available data) and Abstracts Views on Vision4Press platform.
Data correspond to usage on the plateform after 2015. The current usage metrics is available 48-96 hours after online publication and is updated daily on week days.
Initial download of the metrics may take a while.