Fig. 5
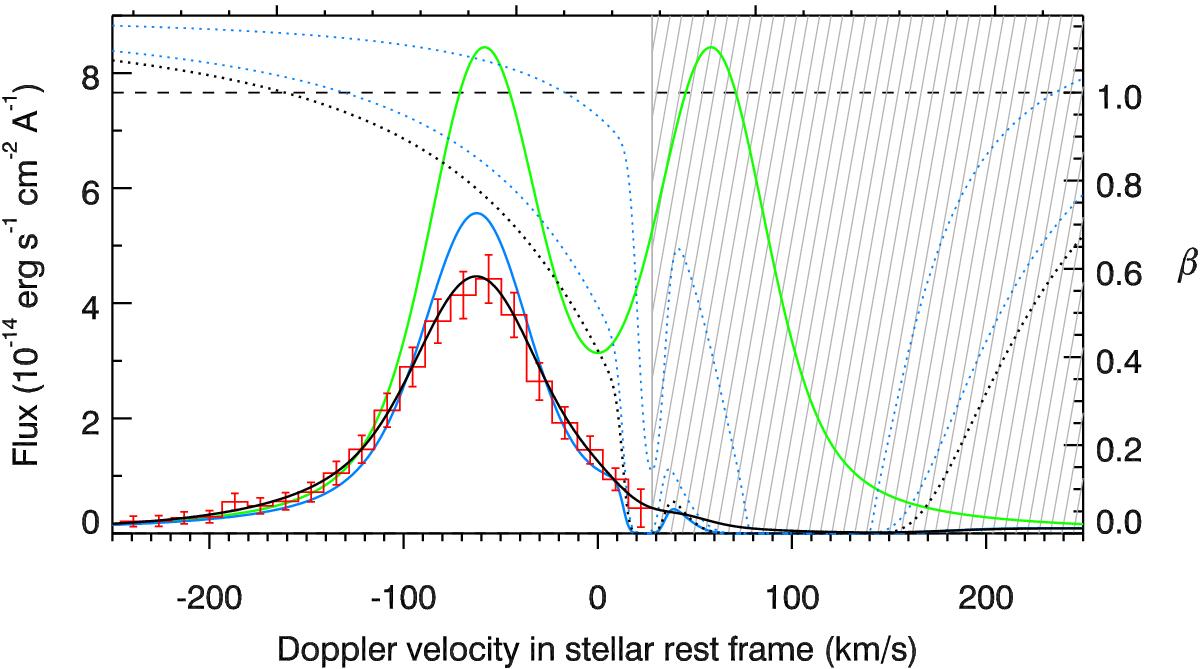
Ly-α line profile of Kepler-444A. The green line shows the theoretical intrinsic stellar emission line profile scaled to the Earth distance. The absorption profiles of the two ISM components toward Kepler-444 A are plotted as dashed blue lines, with their cumulated profile shown as a dashed black line. The solid blue line shows the Ly-α line profile after absorption by the ISM. The solid black line shows its convolution with STIS LSF, before its comparison to the out-of-transit spectrum shown as a red histogram. The hatched region was excluded from the fit. The right axis shows the ratio β between radiation pressure and stellar gravity.
Current usage metrics show cumulative count of Article Views (full-text article views including HTML views, PDF and ePub downloads, according to the available data) and Abstracts Views on Vision4Press platform.
Data correspond to usage on the plateform after 2015. The current usage metrics is available 48-96 hours after online publication and is updated daily on week days.
Initial download of the metrics may take a while.