Fig. 4
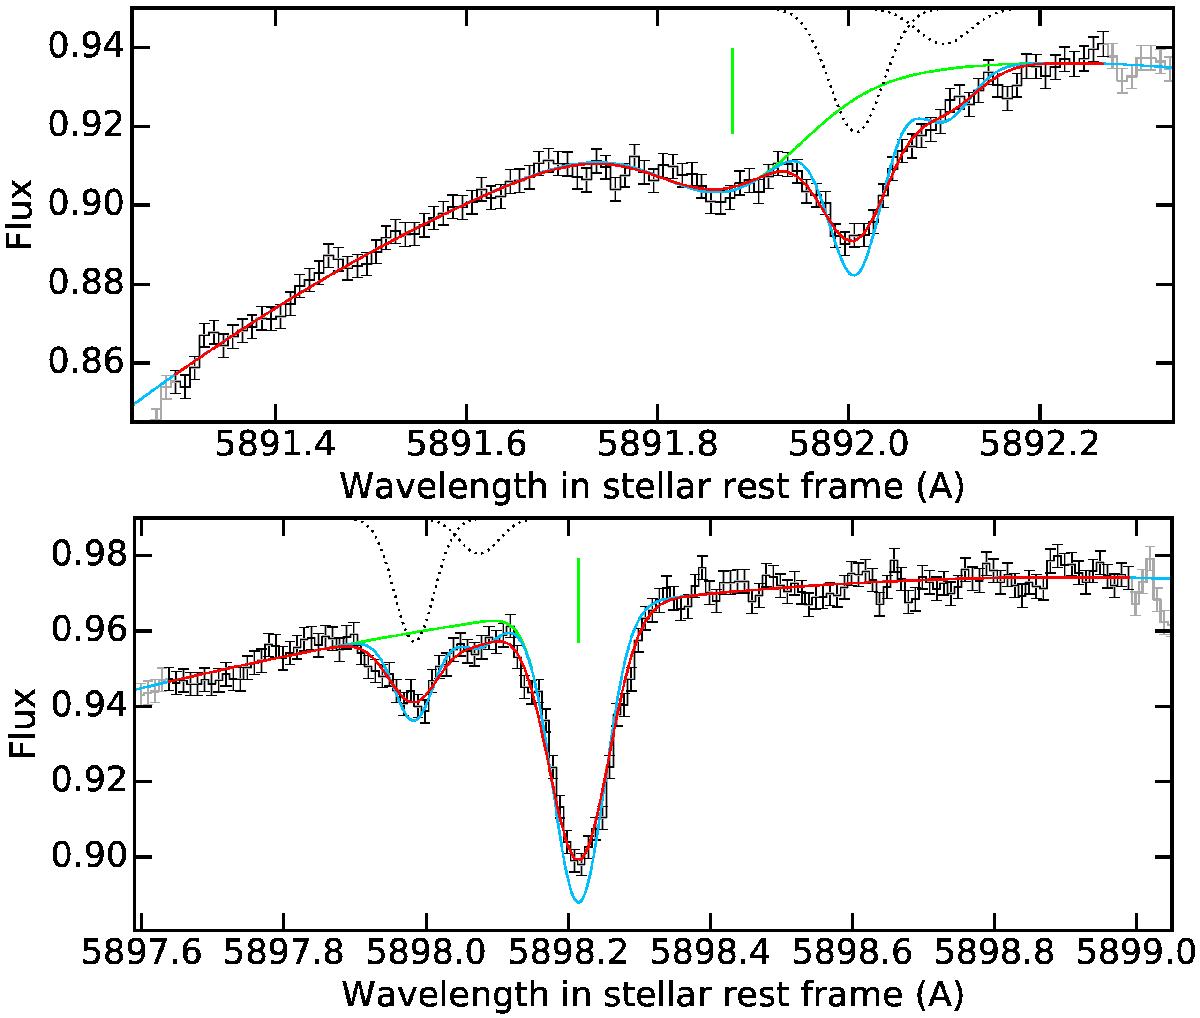
Spectrum of Kepler-444 A in the regions of interstellar absorption from the Na i D2 (top) and Na i D1 (bottom) lines. Our best fit for the intrinsic stellar spectrum (green line) yields the blue spectrum after absorption by two ISM components (absorption profiles displayed as dotted black lines, with the deeper A component blueshifted with respect to the shallower B component). Its convolution with HARPS-N instrumental profile yields the red curve, which was compared with the data over the black points. We note that the Na i D2 absorption line from the A component and the Na i D1 absorption line from the B component are blended with stellar Fe i lines, whose centers are indicated by vertical green lines.
Current usage metrics show cumulative count of Article Views (full-text article views including HTML views, PDF and ePub downloads, according to the available data) and Abstracts Views on Vision4Press platform.
Data correspond to usage on the plateform after 2015. The current usage metrics is available 48-96 hours after online publication and is updated daily on week days.
Initial download of the metrics may take a while.