Fig. 2
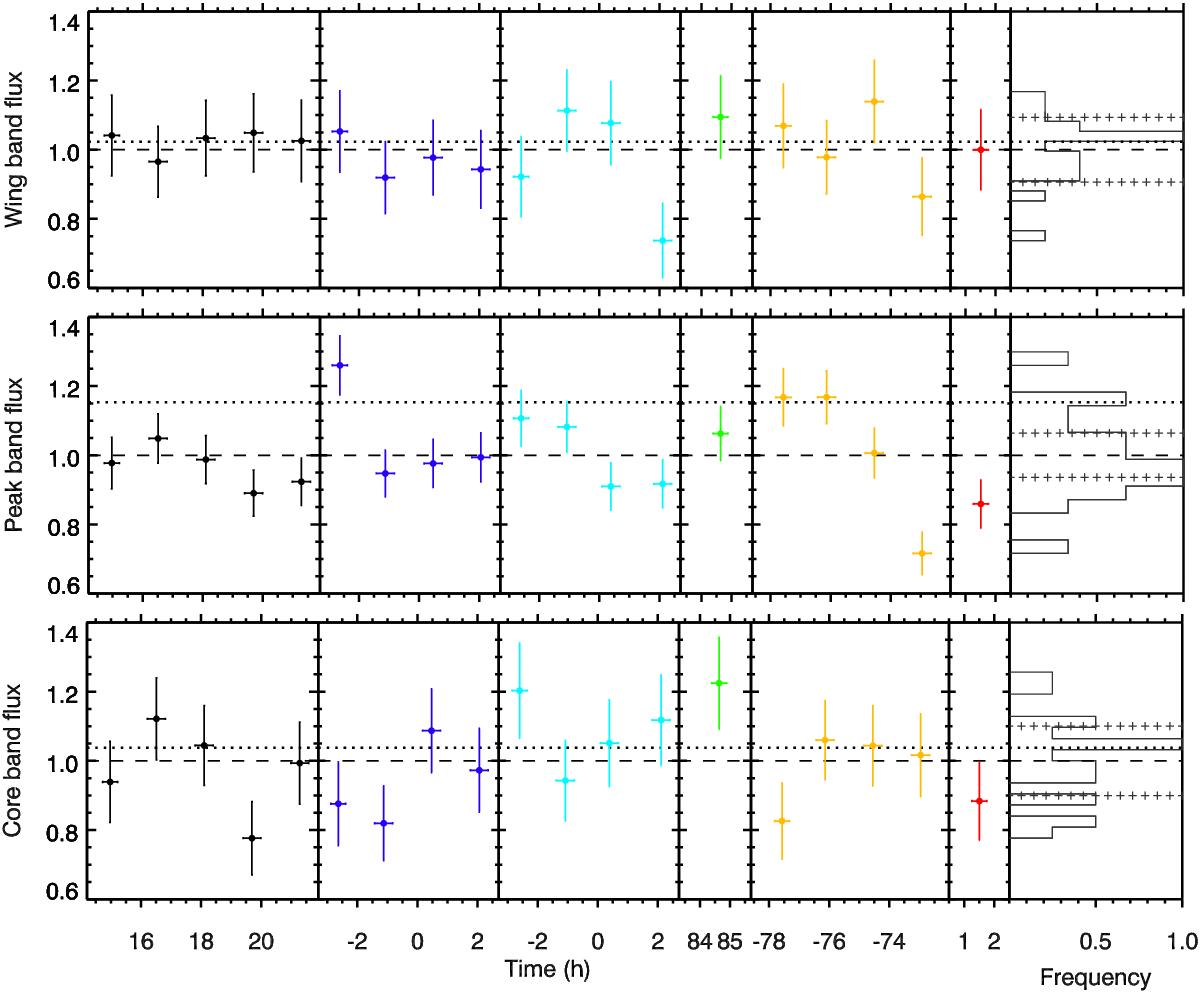
Ly-α flux in Visits A (black), B (deep blue), C (light blue), D (green), E (orange), and F (red). Times are relative to the mid-transit of Kepler-444 f. All spectra have been interpolated over a common wavelength table before being integrated in the complementary wing, peak, and core bands (see text), shown from top to bottom. Fluxes have been normalized by their average over all visits (dashed line). The dotted line corresponds to the spectrum taken as reference for the out-of-transit line. Right panels show the flux distribution in each band. Cross-symbol lines delimit the 68% confidence interval around the average flux if all bands followed the same statistical variations as the wing band.
Current usage metrics show cumulative count of Article Views (full-text article views including HTML views, PDF and ePub downloads, according to the available data) and Abstracts Views on Vision4Press platform.
Data correspond to usage on the plateform after 2015. The current usage metrics is available 48-96 hours after online publication and is updated daily on week days.
Initial download of the metrics may take a while.