Fig. 1
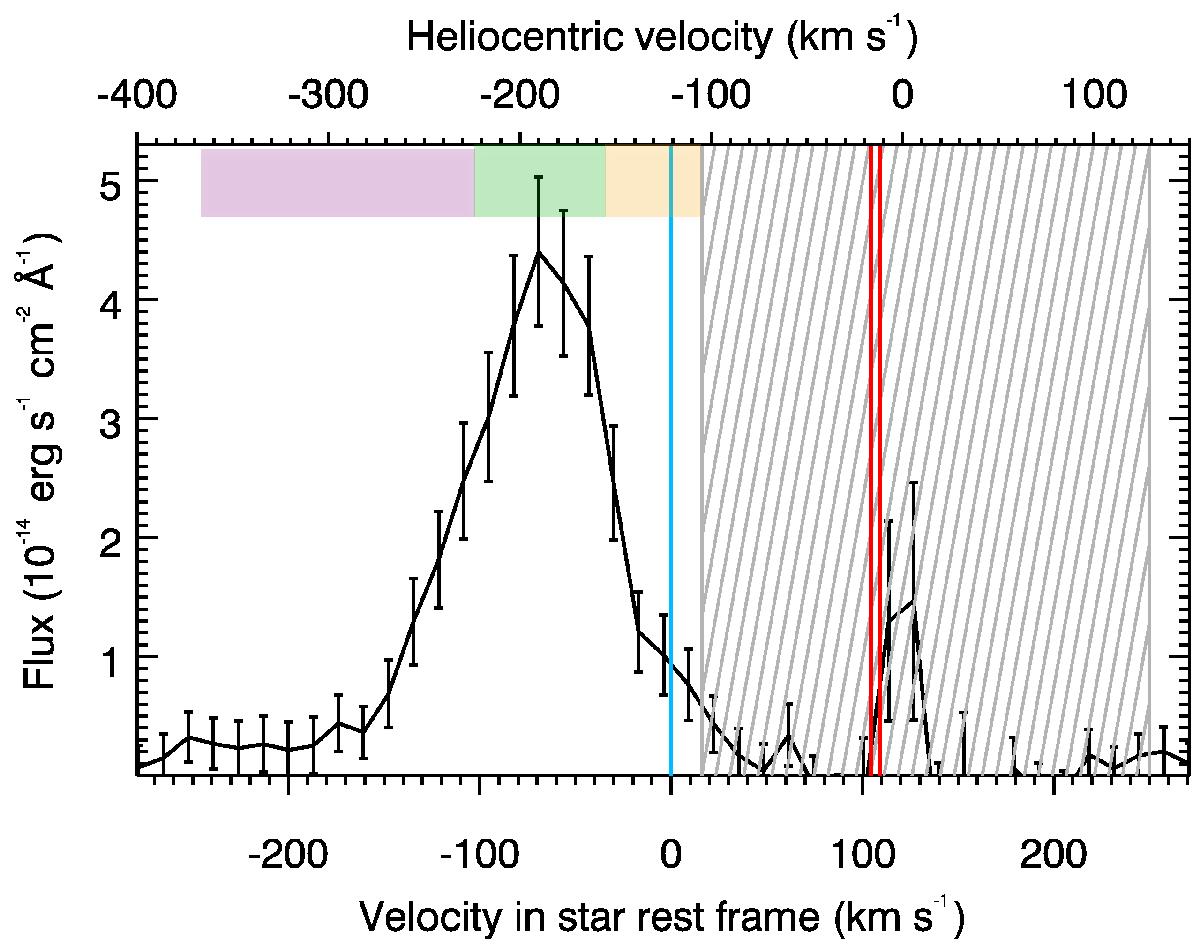
Ly-α line spectrum of Kepler-444A plotted as a function of Doppler velocity in the star rest frame (lower axis) and in the heliocentric rest frame (upper axis). The black line shows a typical measurement of the stellar line with HST/STIS (first orbit of Visit E). The violet, green, and orange bands indicate the spectral ranges of the wing, peak, and core bands, respectively. The blue line indicates the velocity of the star, and the red lines the velocities of the two ISM components along the LOS. The red wing of the Ly-α line cannot be observed from Earth because of ISM absorption along the LOS. The hatched region is further contaminated by geocoronal emission.
Current usage metrics show cumulative count of Article Views (full-text article views including HTML views, PDF and ePub downloads, according to the available data) and Abstracts Views on Vision4Press platform.
Data correspond to usage on the plateform after 2015. The current usage metrics is available 48-96 hours after online publication and is updated daily on week days.
Initial download of the metrics may take a while.