Fig. 8
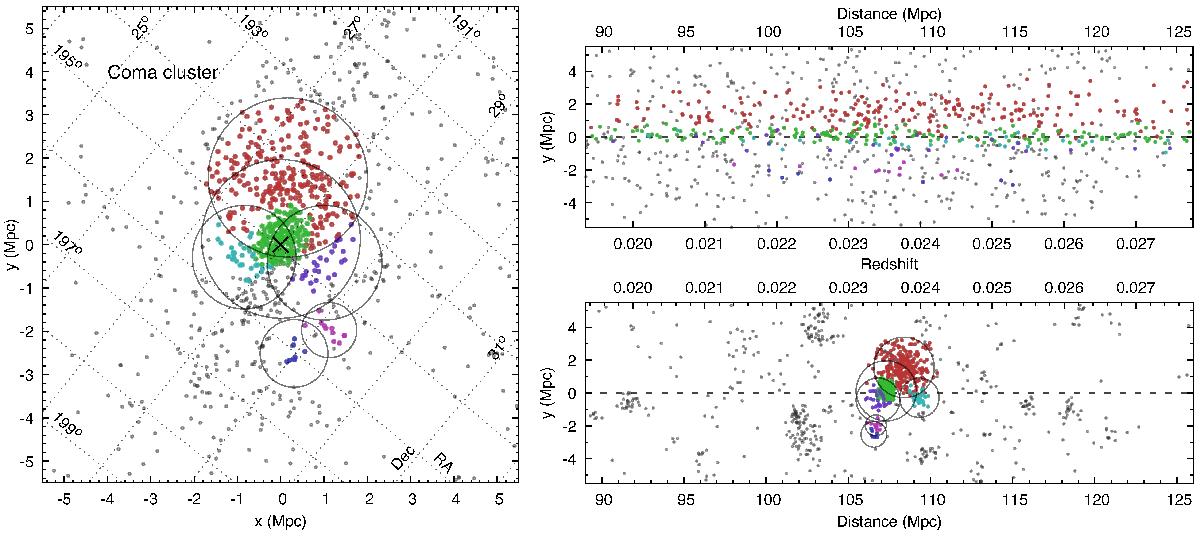
Distribution of galaxies around the Coma cluster region. Left panel: distribution of galaxies in the sky plane (in arbitrary cartesian coordinates), while the right ascensions and declinations are shown as dotted lines. Upper right panel: observed distribution of galaxies along the line of sight. Lower right panel: distribution of galaxies after correction for the redshift space distortions. The redshifts shown in the panels are heliocentric observed redshifts, while the distances are comoving distances given in a CMB frame. Each subcomponent of the Coma cluster is marked as a coloured point and all other galaxies are marked as grey points. The circle around each component is the virial radius (R200) of the system.
Current usage metrics show cumulative count of Article Views (full-text article views including HTML views, PDF and ePub downloads, according to the available data) and Abstracts Views on Vision4Press platform.
Data correspond to usage on the plateform after 2015. The current usage metrics is available 48-96 hours after online publication and is updated daily on week days.
Initial download of the metrics may take a while.