Fig. 7
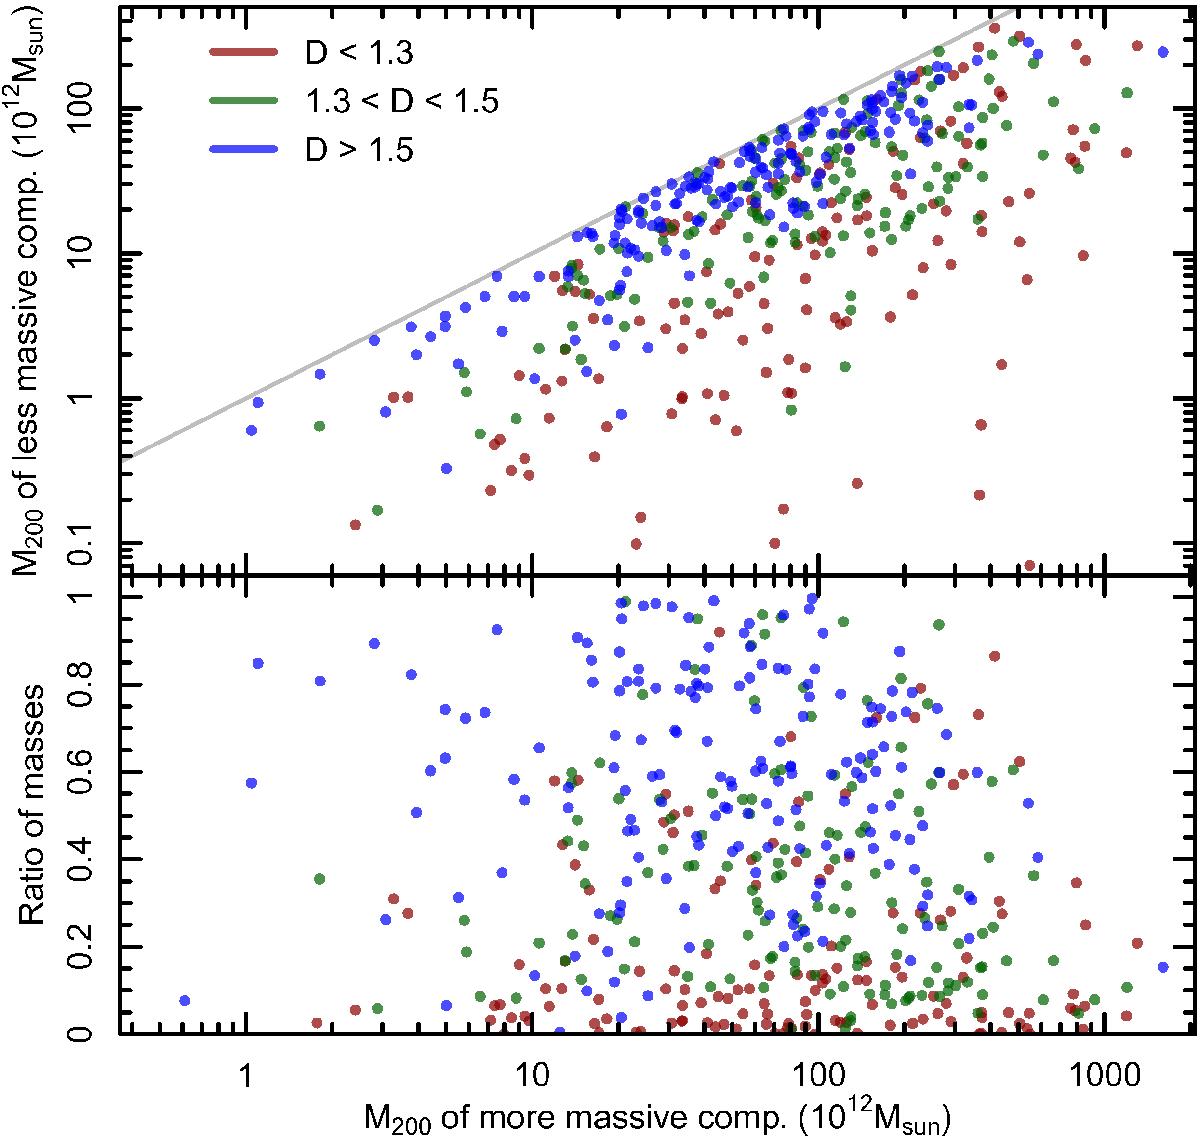
Comparison of the masses of the two-component merging groups. In the top panel the more massive component is shown on the x-axis and the less massive one on the y-axis. The sample is divided into three subsamples based on the distance between components, normalized with the R200: D = d/ max(R200,1,R200,2), where d is the distance between two components. The one-to-one relationship is denoted with a grey line. The bottom panel shows the ratio of the masses as a function of the more massive component.
Current usage metrics show cumulative count of Article Views (full-text article views including HTML views, PDF and ePub downloads, according to the available data) and Abstracts Views on Vision4Press platform.
Data correspond to usage on the plateform after 2015. The current usage metrics is available 48-96 hours after online publication and is updated daily on week days.
Initial download of the metrics may take a while.