Fig. 4
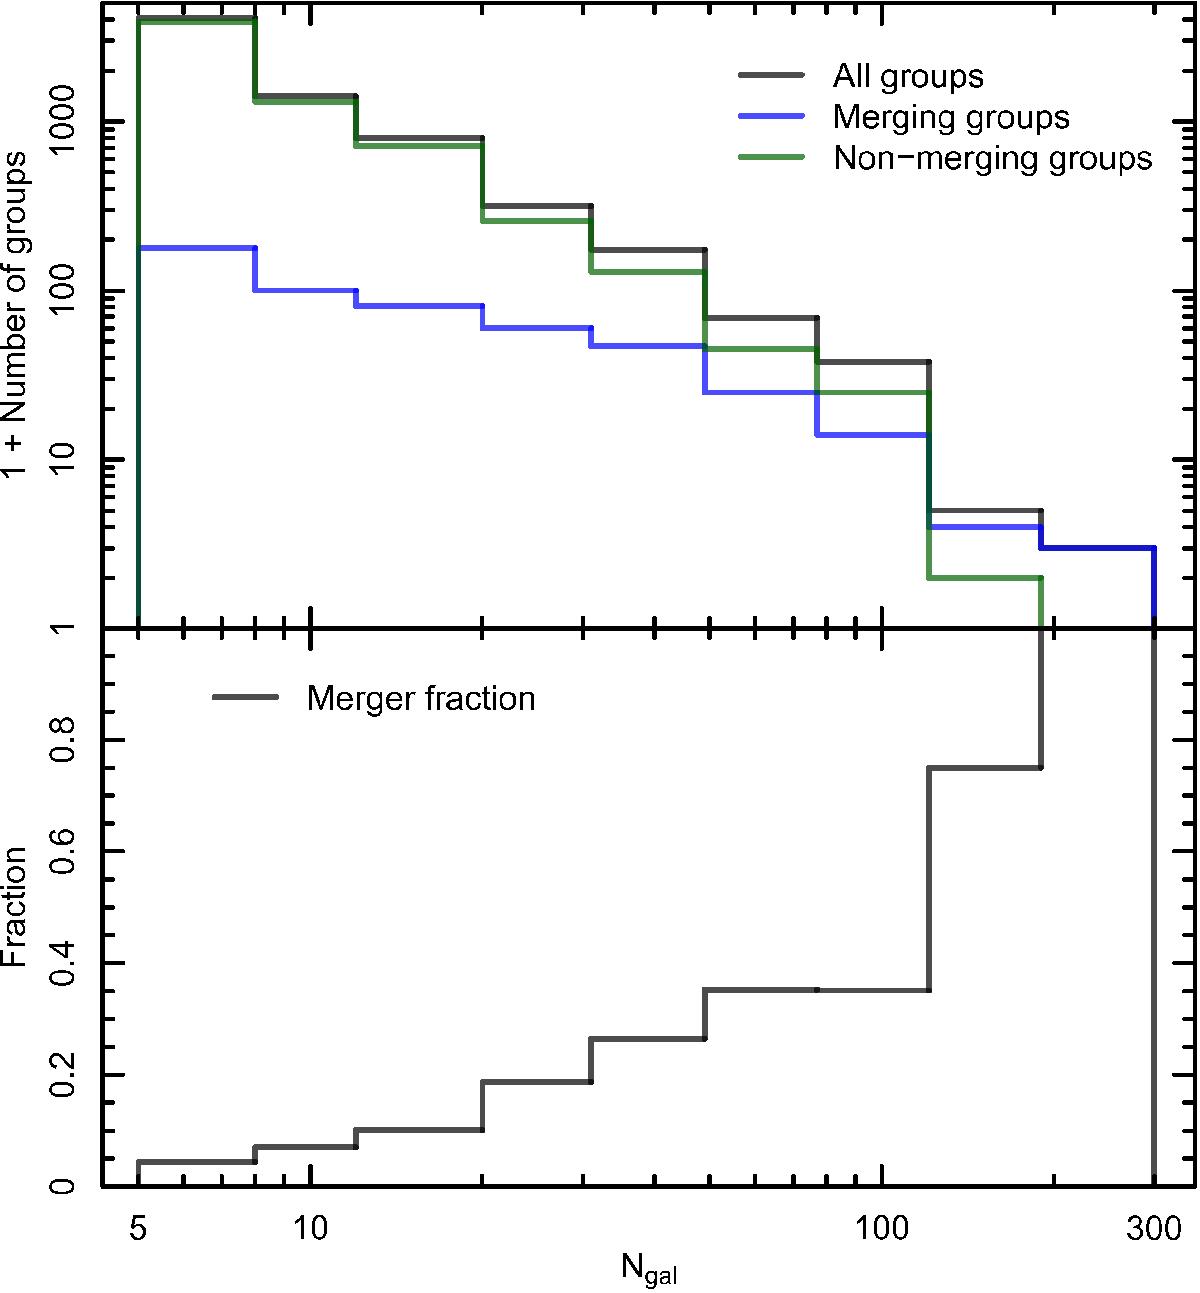
Upper panel: number of groups (black line), mergers (blue line), and non-mergers (green line) per group richness (number of galaxies in a group) bin. Lower panel: fraction of potentially merging systems as a function of group richness. The strong increase in merger fraction with group richness in the lower panel is affected by the flux-limited survey.
Current usage metrics show cumulative count of Article Views (full-text article views including HTML views, PDF and ePub downloads, according to the available data) and Abstracts Views on Vision4Press platform.
Data correspond to usage on the plateform after 2015. The current usage metrics is available 48-96 hours after online publication and is updated daily on week days.
Initial download of the metrics may take a while.