Fig. 3
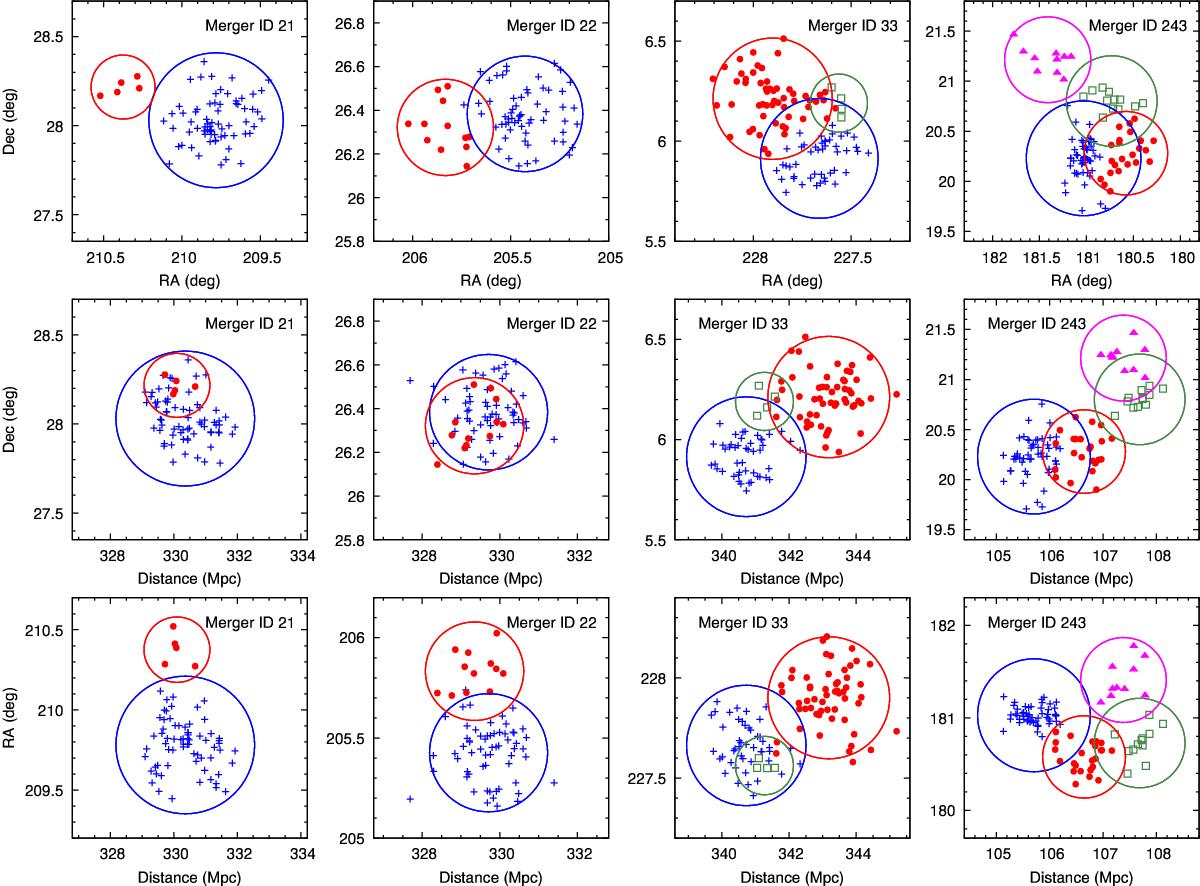
Example of four merging systems in the catalogue. All subgroups in the merging systems are marked with different colours and symbols. The circle around each component shows the estimated size of virial radius R200. The scale of the sky coordinates (RA, Dec) are chosen to correspond to the distance scale used in the figure. The top row gives the view in sky plane, while the middle and bottom rows give the view in declination-distance and RA-distance planes, respectively. For distances we use the Fingers-of-God corrected distances which corrects for the smearing of galaxy groups along the line of sight.
Current usage metrics show cumulative count of Article Views (full-text article views including HTML views, PDF and ePub downloads, according to the available data) and Abstracts Views on Vision4Press platform.
Data correspond to usage on the plateform after 2015. The current usage metrics is available 48-96 hours after online publication and is updated daily on week days.
Initial download of the metrics may take a while.