Fig. 12
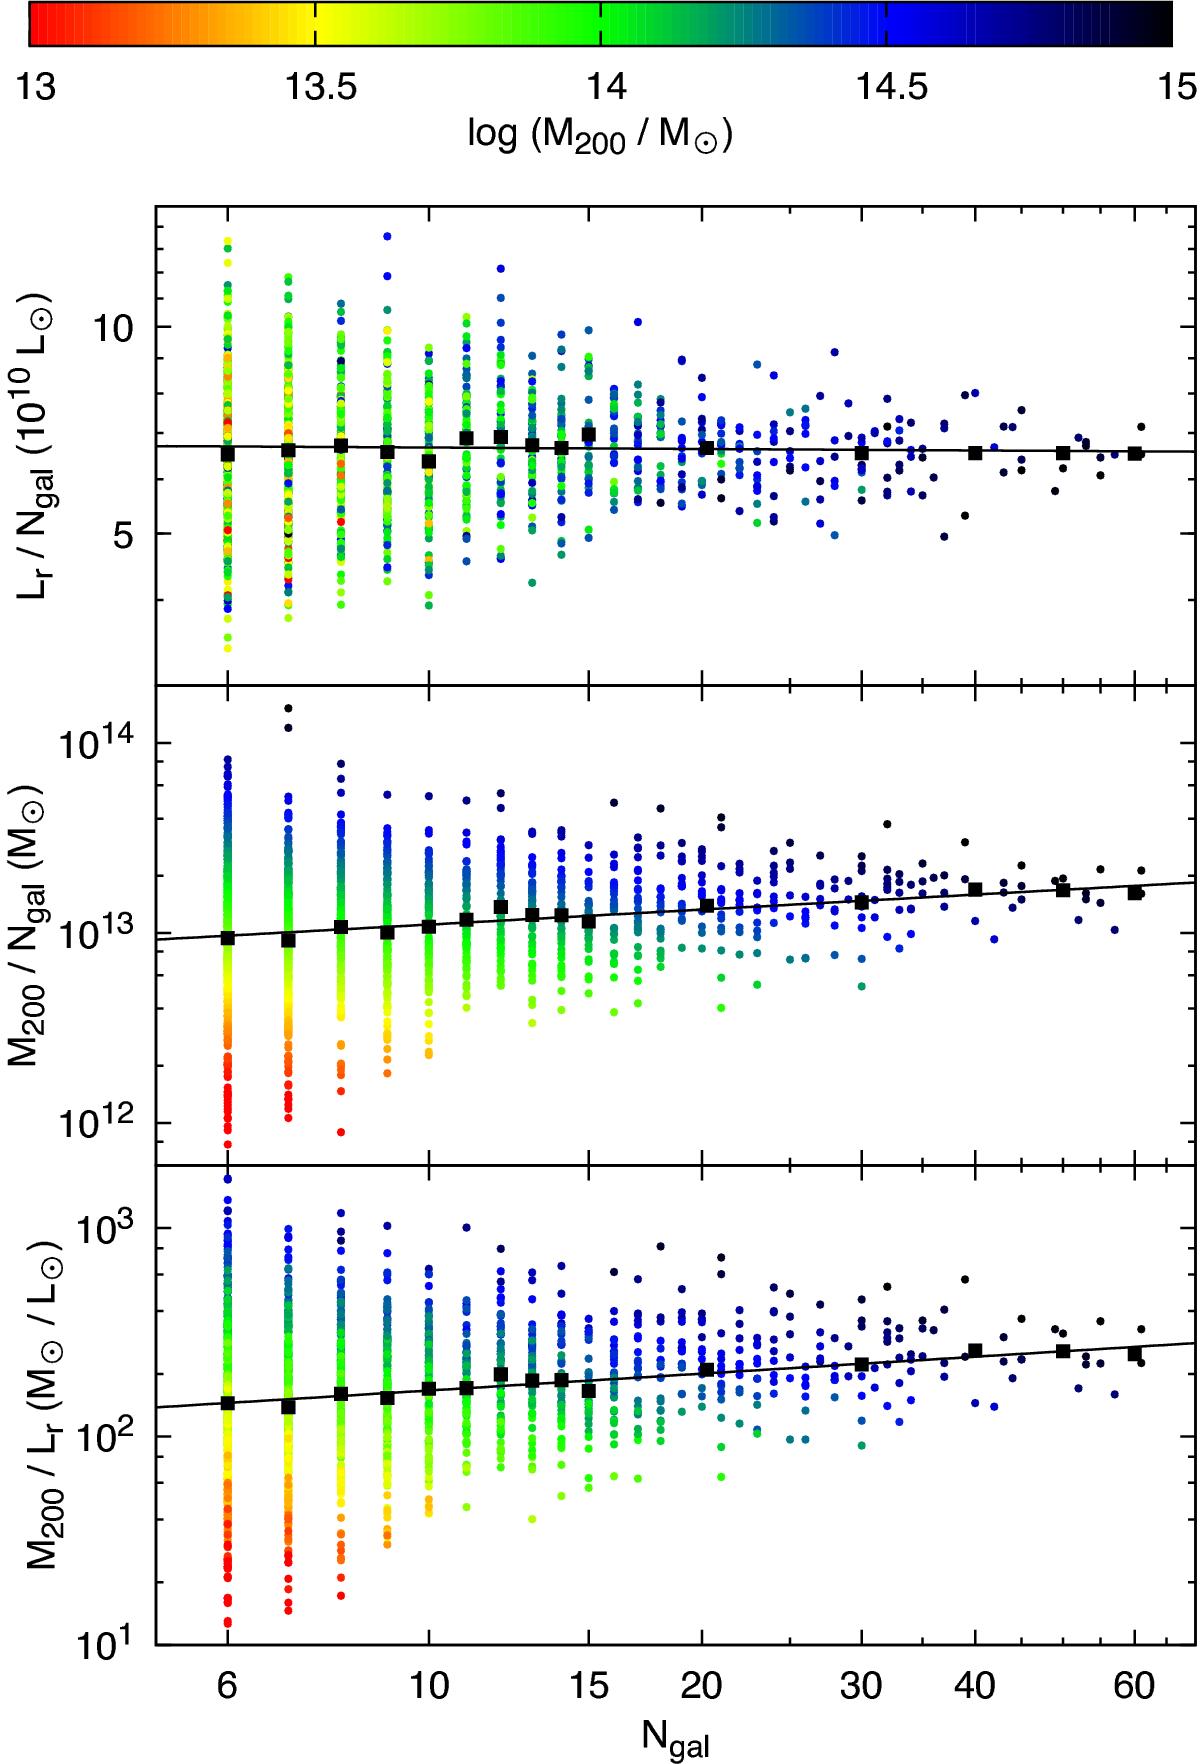
Group luminosity-richness ratio (top panel), mass-richness ratio (middle panel), and mass-to-light ratio (bottom panel) as functions of richness in the volume-limited sample (Mr< − 20.84). Different group masses are indicated according to the colour bar at the top. Black squares give mean values in richness bins, solid black lines are linear least-square fits to the binned data.
Current usage metrics show cumulative count of Article Views (full-text article views including HTML views, PDF and ePub downloads, according to the available data) and Abstracts Views on Vision4Press platform.
Data correspond to usage on the plateform after 2015. The current usage metrics is available 48-96 hours after online publication and is updated daily on week days.
Initial download of the metrics may take a while.