Fig. 11
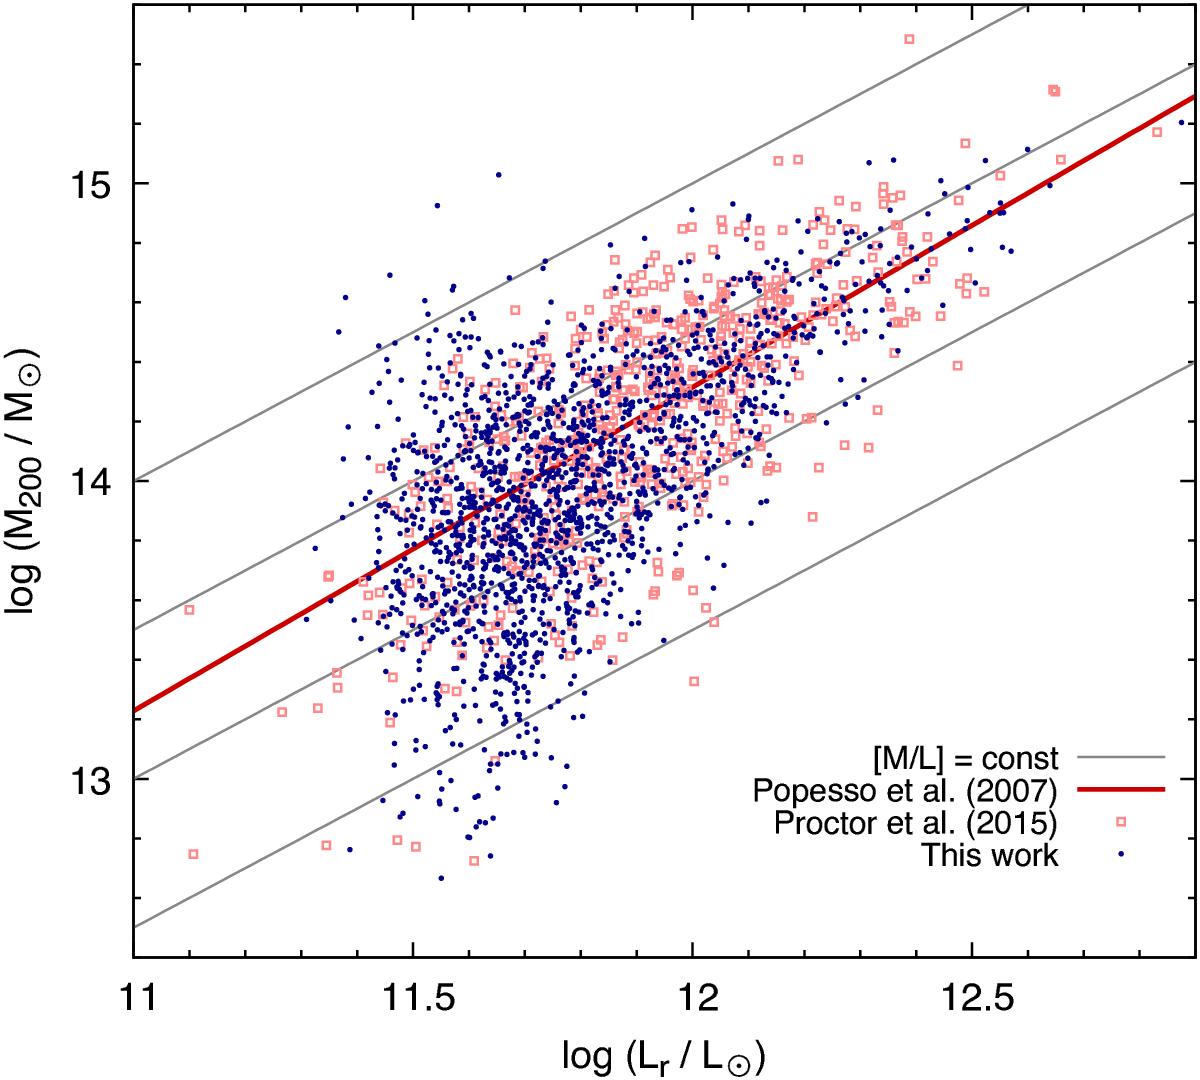
Masses of galaxy groups as a function of group total r-band luminosity. Blue points denote our data in the volume-limited sample with at least six group members. The red open squares and the red line indicate data from the literature (Popesso et al. 2007; Proctor et al. 2015). The grey lines show constant log (M/L) values of 3.0, 2.5, 2.0, and 1.5 (from top left to bottom right).
Current usage metrics show cumulative count of Article Views (full-text article views including HTML views, PDF and ePub downloads, according to the available data) and Abstracts Views on Vision4Press platform.
Data correspond to usage on the plateform after 2015. The current usage metrics is available 48-96 hours after online publication and is updated daily on week days.
Initial download of the metrics may take a while.