Free Access
Fig. C.16
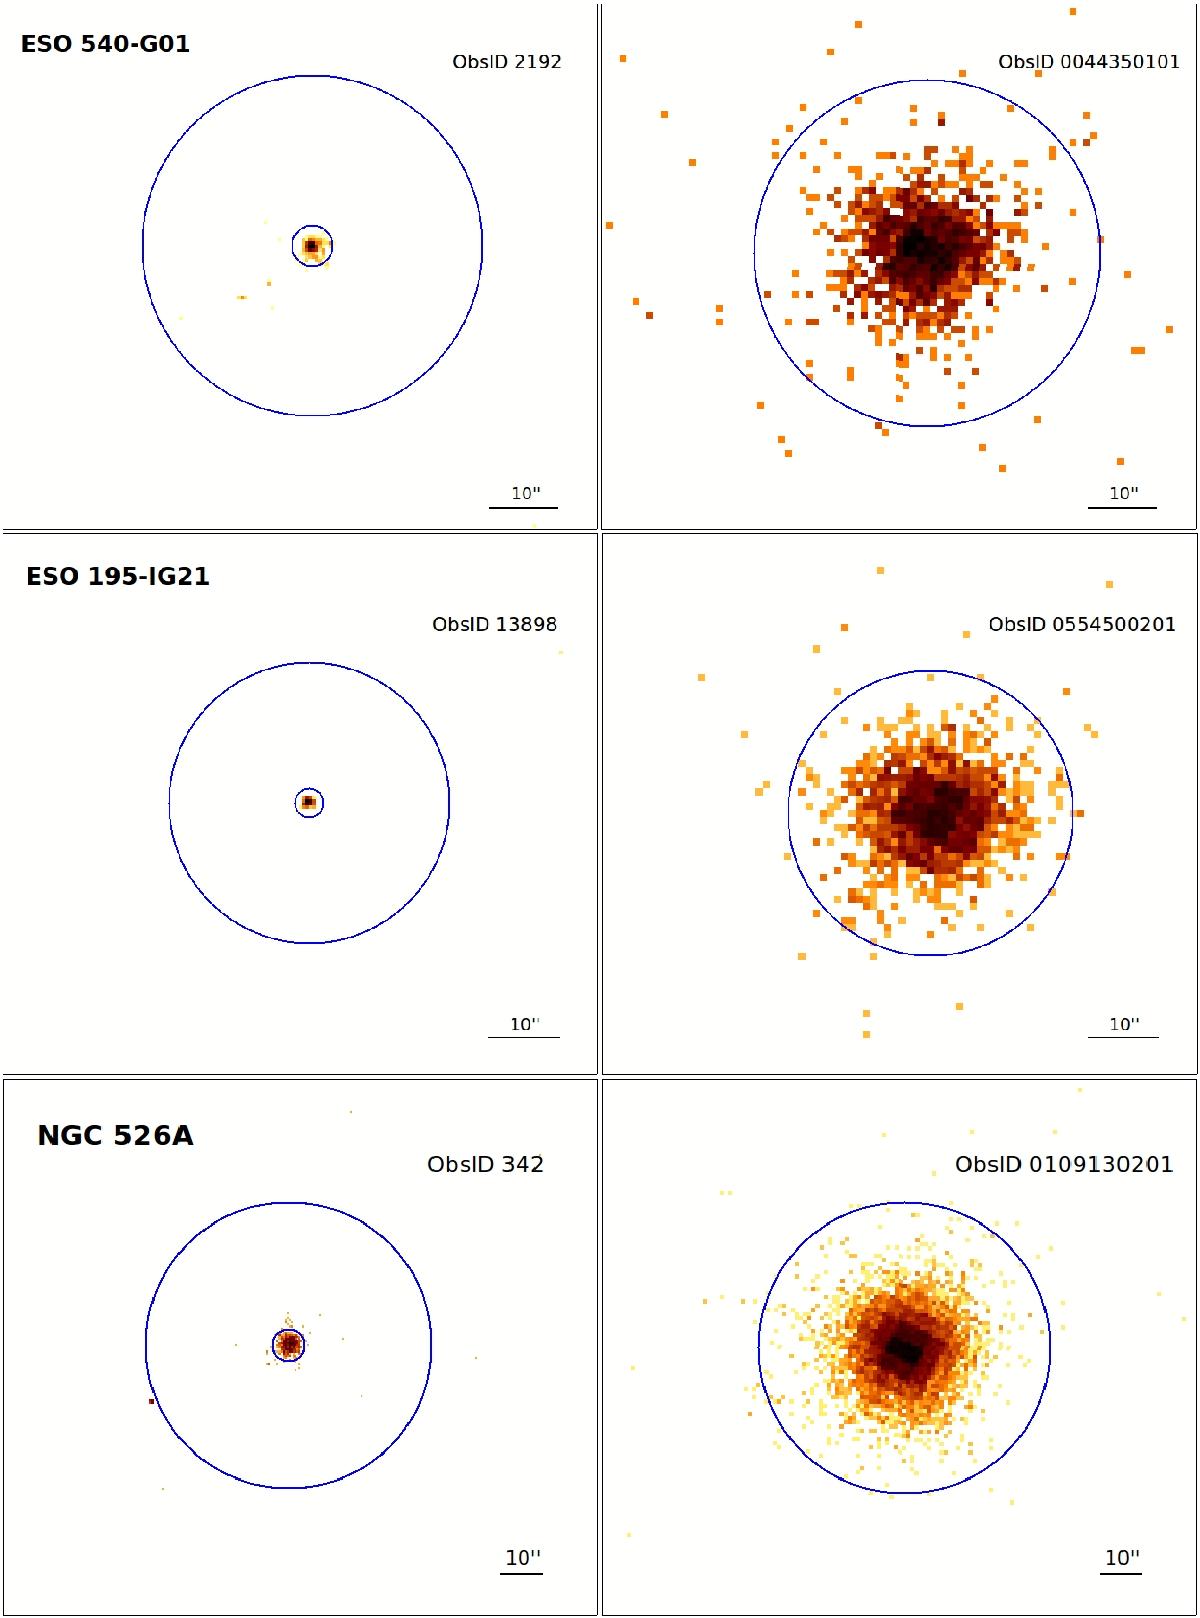
Chandra data (left) and XMM–Newton data (right) for the sources in the 0.5–10 keV band. Big circles represent XMM-Newton data apertures. Small circles in the figures to the left represent the nuclear extraction aperture used with Chandra observations (see Table A.1).
This figure is made of several images, please see below:
Current usage metrics show cumulative count of Article Views (full-text article views including HTML views, PDF and ePub downloads, according to the available data) and Abstracts Views on Vision4Press platform.
Data correspond to usage on the plateform after 2015. The current usage metrics is available 48-96 hours after online publication and is updated daily on week days.
Initial download of the metrics may take a while.