Fig. 9
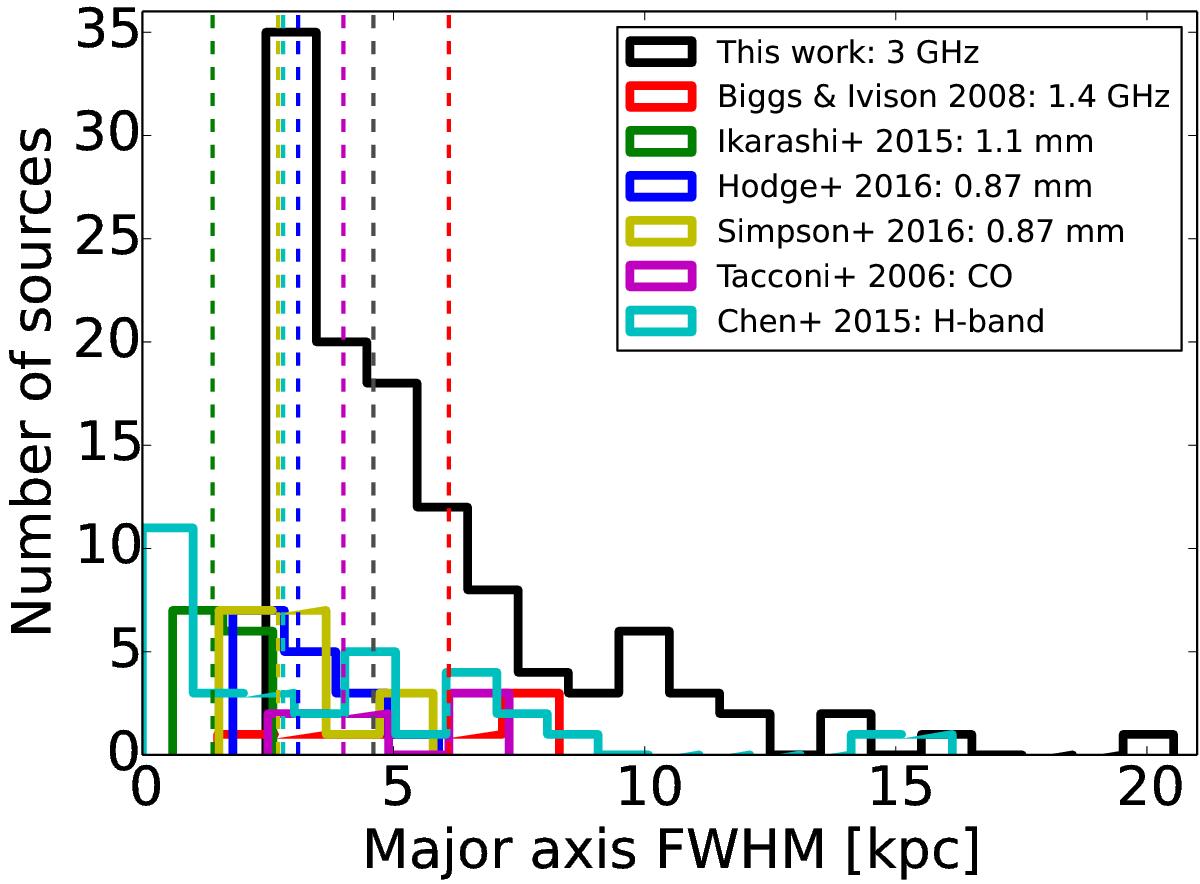
Distributions of the SMG sizes (major axis FWHM) measured in radio, dust, CO, and stellar emissions. The black histogram shows the sizes of our COSMOS ASTE/AzTEC SMGs as seen at νobs = 3 GHz. The red, green, blue, yellow, magenta, and cyan histograms show the 1.4 GHz sizes from Biggs & Ivison (2008), 1.1 mm (rest-frame FIR) sizes from Ikarashi et al. (2015), 870 μm sizes from Hodge et al. (2016) and Simpson et al. (2017), CO-emitting sizes from Tacconi et al. (2006), and the stellar emission sizes from Chen et al. (2015). The bin size is 1 kpc. The upper size limits were placed in the bins corresponding to those values, which is causing the apparent peak in our radio size distribution. The vertical dashed lines show the corresponding median sizes (4.6 kpc for our SMGs, 6.1 kpc for the Biggs & Ivison 2008 SMGs, 1.4 kpc for the Ikarashi et al. 2015 SMGs, 3.1 kpc and 2.7 kpc for the Hodge et al. 2016 and Simpson et al. 2017 SMGs, respectively, 4.0 kpc for the CO sizes from Tacconi et al. 2006, and 2.8 kpc for the stellar sizes from Chen et al. 2015; survival analysis was used to take the upper size limits into account when calculating the median sizes). See text for details.
Current usage metrics show cumulative count of Article Views (full-text article views including HTML views, PDF and ePub downloads, according to the available data) and Abstracts Views on Vision4Press platform.
Data correspond to usage on the plateform after 2015. The current usage metrics is available 48-96 hours after online publication and is updated daily on week days.
Initial download of the metrics may take a while.