Fig. 8
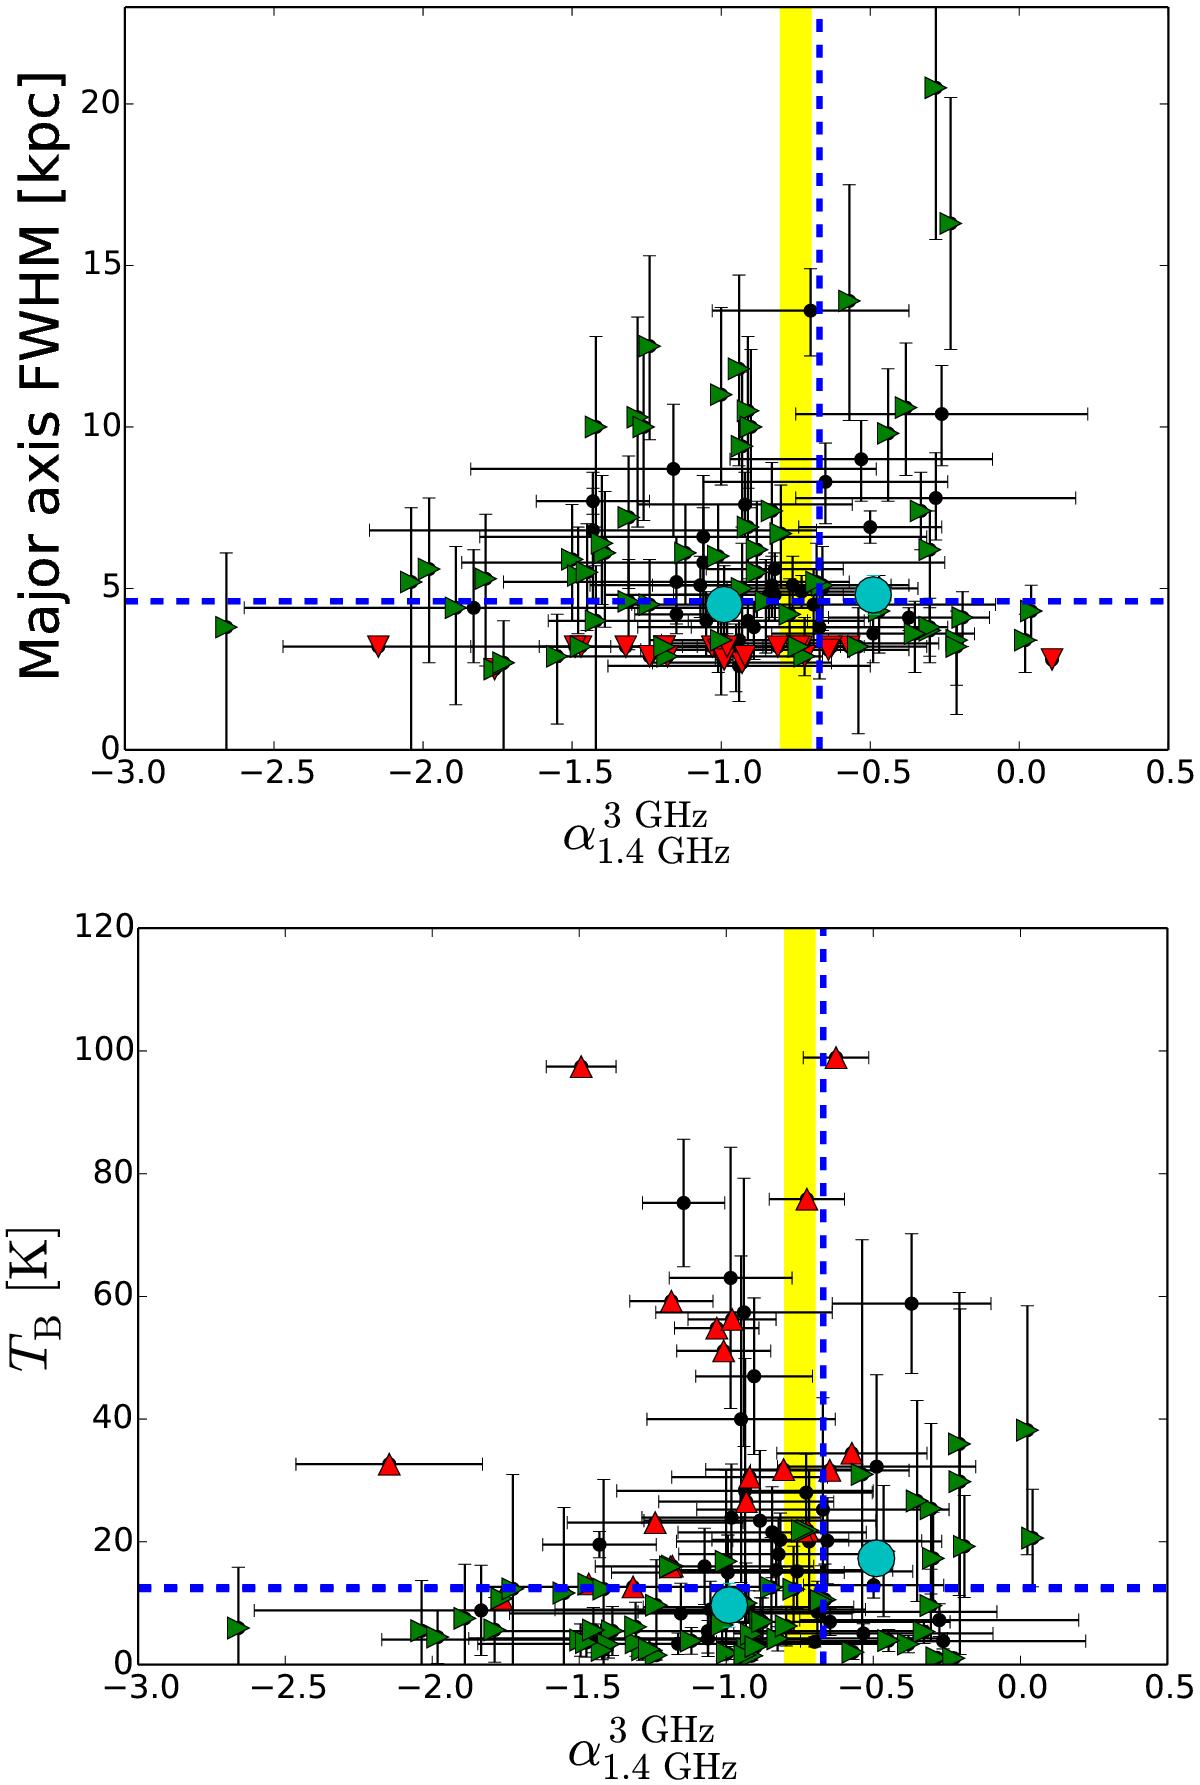
Top: linear major axis FWHM size at 3 GHz plotted against the radio spectral index between the observed frequencies of 1.4 GHz and 3 GHz. The green right-pointing triangles indicate the lower ![]() limits, while the red down-pointing triangles show the upper size limits. The cyan filled circles represent the median values of the binned data with the error bars showing the standard errors of the median values. The steeper spectral index bin contains 57 SMGs, while the flatter one contains 58 SMGs. The large number of censored data points allowed us to only halve the sample to apply survival analysis. The horizontal dashed line marks the median major axis FWHM size of our SMGs (4.6 kpc), and the vertical dashed line marks the sample median spectral index of
limits, while the red down-pointing triangles show the upper size limits. The cyan filled circles represent the median values of the binned data with the error bars showing the standard errors of the median values. The steeper spectral index bin contains 57 SMGs, while the flatter one contains 58 SMGs. The large number of censored data points allowed us to only halve the sample to apply survival analysis. The horizontal dashed line marks the median major axis FWHM size of our SMGs (4.6 kpc), and the vertical dashed line marks the sample median spectral index of ![]() . For reference, the yellow shaded band shows the radio spectral index range of αsynch ∈ [−0.8, −0.7], which is typical of the non-thermal synchrotron radio emission from star-forming galaxies. Bottom: 3 GHz brightness temperature as a function of
. For reference, the yellow shaded band shows the radio spectral index range of αsynch ∈ [−0.8, −0.7], which is typical of the non-thermal synchrotron radio emission from star-forming galaxies. Bottom: 3 GHz brightness temperature as a function of ![]() . The symbols are as in the top panel, except that the red triangles pointing up indicate the lower TB limits. The two partly overlapping horizontal dashed lines mark the median TB values for the full sample (12.6 K) and for a sample from which the VLBA detected sources were removed (12.3 K). The VLBA detected high-TB sources are not shown for the sake of clarity, but they are included in the binned data.
. The symbols are as in the top panel, except that the red triangles pointing up indicate the lower TB limits. The two partly overlapping horizontal dashed lines mark the median TB values for the full sample (12.6 K) and for a sample from which the VLBA detected sources were removed (12.3 K). The VLBA detected high-TB sources are not shown for the sake of clarity, but they are included in the binned data.
Current usage metrics show cumulative count of Article Views (full-text article views including HTML views, PDF and ePub downloads, according to the available data) and Abstracts Views on Vision4Press platform.
Data correspond to usage on the plateform after 2015. The current usage metrics is available 48-96 hours after online publication and is updated daily on week days.
Initial download of the metrics may take a while.