Fig. 7
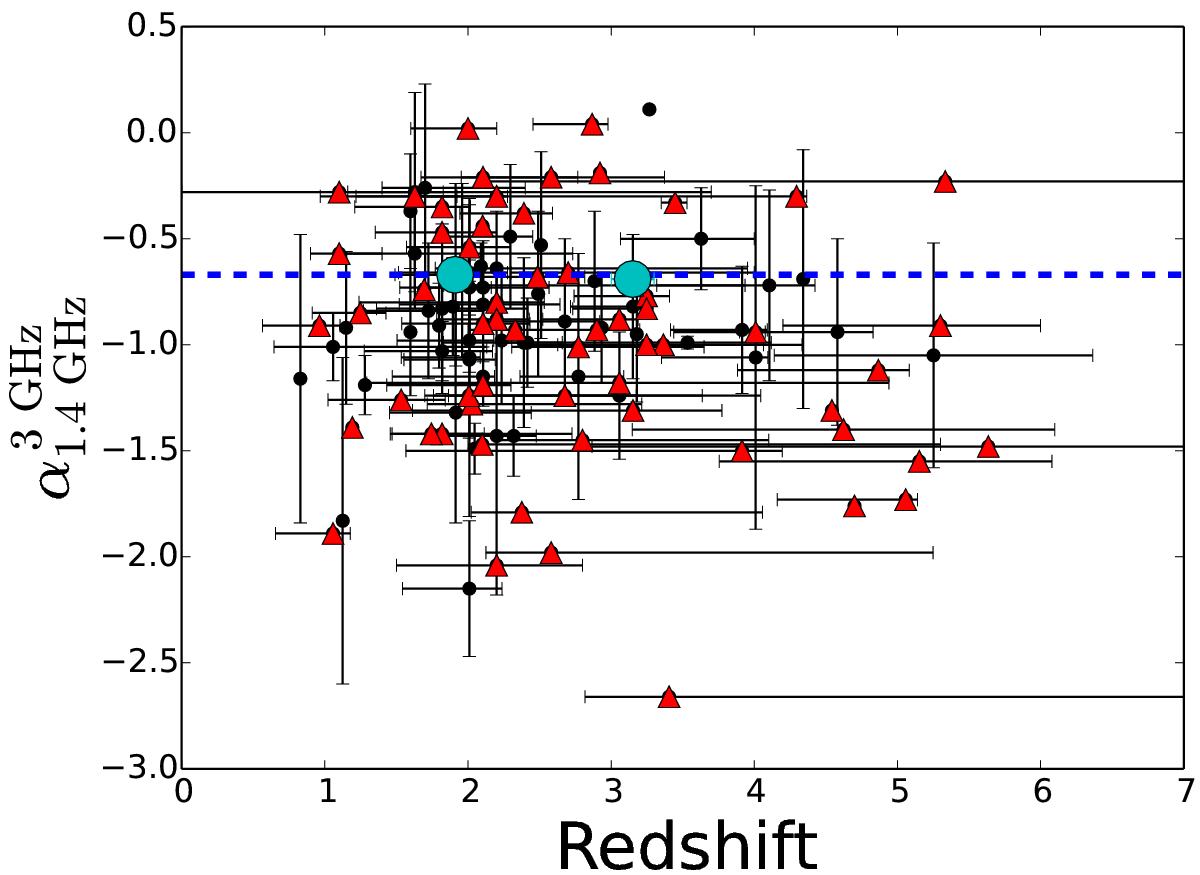
Radio spectral index between the observed-frame frequencies of 1.4 and 3 GHz plotted as a function of redshift. The red up-pointing triangles show the lower ![]() limits. The cyan filled circles represent the median values of the binned data with the error bars showing the corresponding standard errors. The lower redshift bin contains 57 SMGs, while the higher redshift bin contains 58 SMGs. The large number of censored
limits. The cyan filled circles represent the median values of the binned data with the error bars showing the corresponding standard errors. The lower redshift bin contains 57 SMGs, while the higher redshift bin contains 58 SMGs. The large number of censored ![]() values allowed us to only halve the sample to apply survival analysis. The horizontal dashed line marks the median spectral index of
values allowed us to only halve the sample to apply survival analysis. The horizontal dashed line marks the median spectral index of ![]() , which was calculated using a survival analysis technique.
, which was calculated using a survival analysis technique.
Current usage metrics show cumulative count of Article Views (full-text article views including HTML views, PDF and ePub downloads, according to the available data) and Abstracts Views on Vision4Press platform.
Data correspond to usage on the plateform after 2015. The current usage metrics is available 48-96 hours after online publication and is updated daily on week days.
Initial download of the metrics may take a while.