Fig. 6
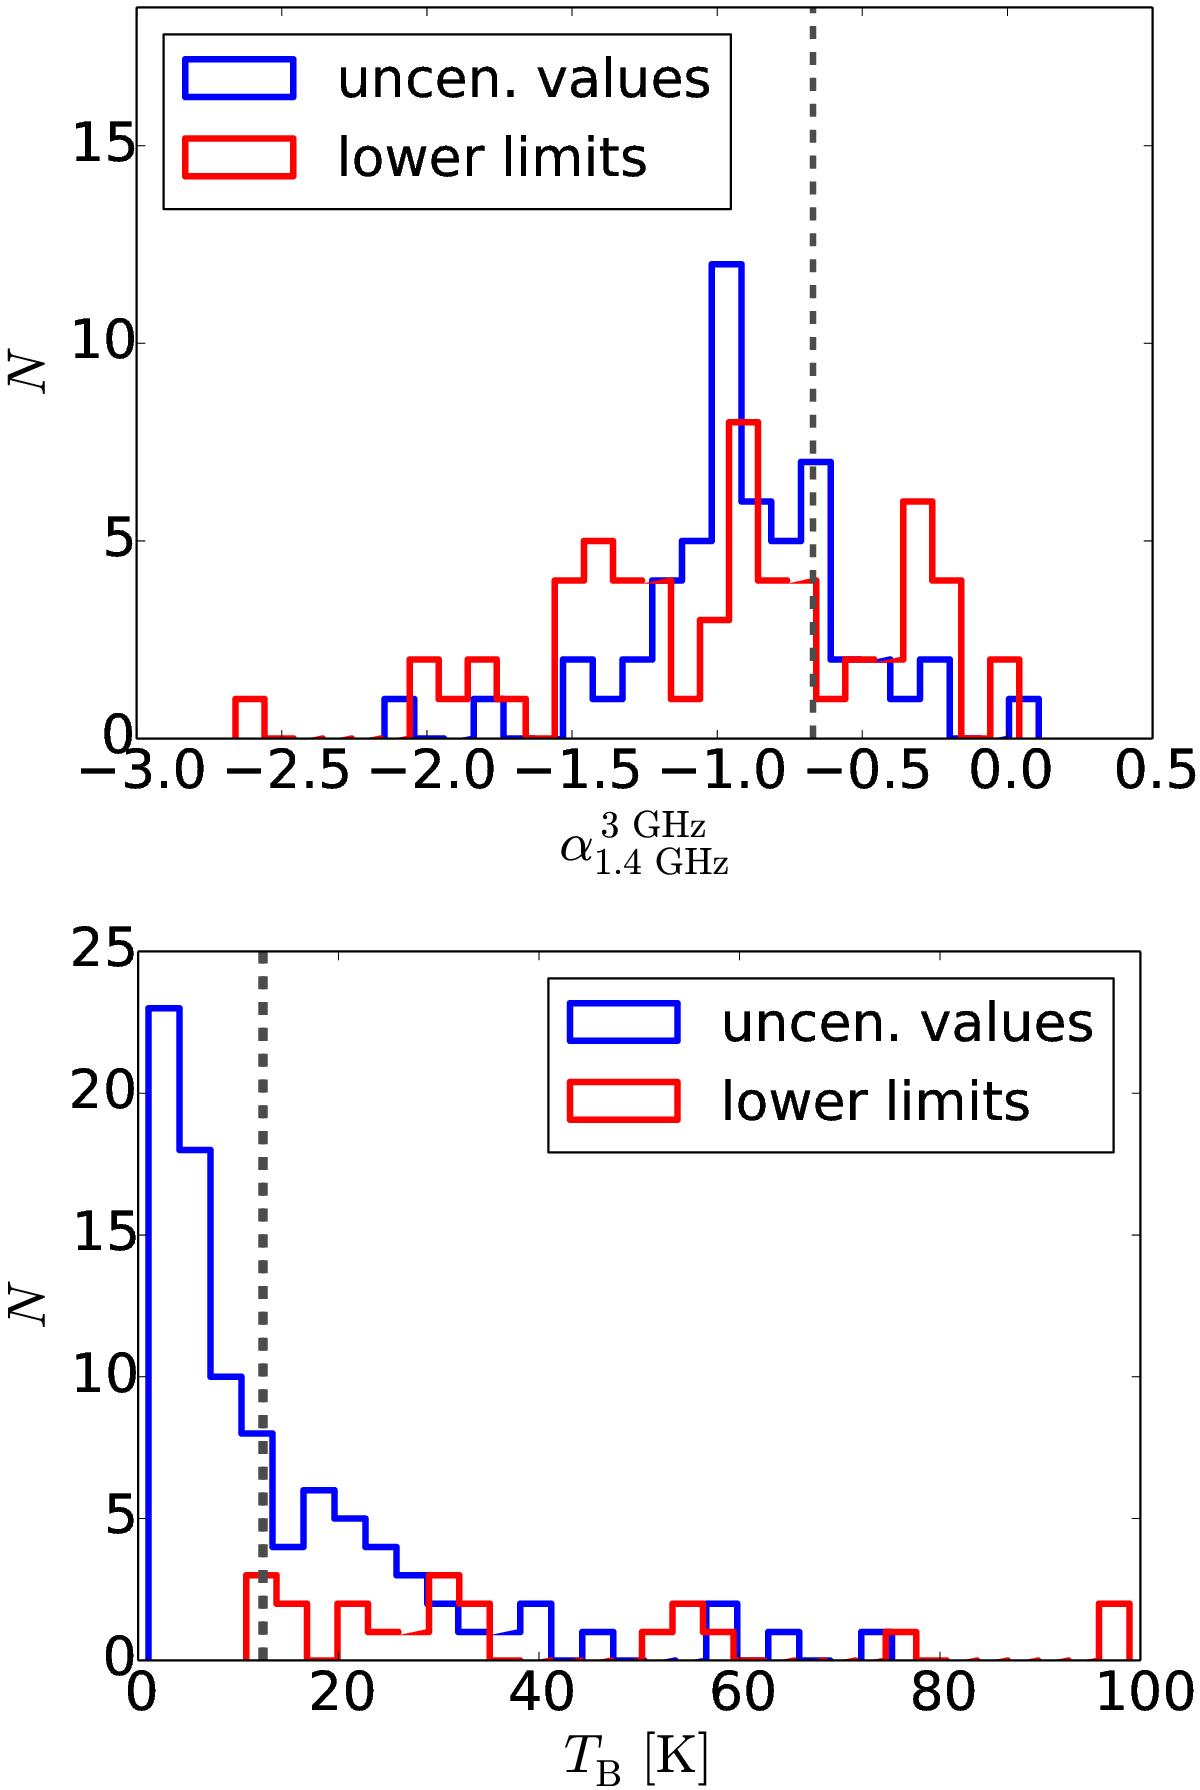
Top: distribution of the 1.4–3 GHz radio spectral indices. The distributions of the uncensored values and the lower limits (placed in the bins corresponding to those values) are shown separately by the blue and red histograms, respectively. In both cases, the histogram bin size is 0.1. The sample median, shown by the vertical dashed line, is ![]() (same for the full sample and a sample from which the three VLBA-detected sources were removed; Table 2). Bottom: distribution of the νobs = 3 GHz brightness temperatures, where the VLBA-detected sources with high TB values are omitted for legibility purposes. Again, the uncensored values and the lower limits are plotted separately. The bin size is 3 K. The median values, TB = 12.6 K for the full sample and TB = 12.3 K for a sample from which the VLBA-detected sources were removed, are marked by the vertical dashed lines (the two lines are nearly indistinguishable owing to a minute, 0.3 K difference in the medians).
(same for the full sample and a sample from which the three VLBA-detected sources were removed; Table 2). Bottom: distribution of the νobs = 3 GHz brightness temperatures, where the VLBA-detected sources with high TB values are omitted for legibility purposes. Again, the uncensored values and the lower limits are plotted separately. The bin size is 3 K. The median values, TB = 12.6 K for the full sample and TB = 12.3 K for a sample from which the VLBA-detected sources were removed, are marked by the vertical dashed lines (the two lines are nearly indistinguishable owing to a minute, 0.3 K difference in the medians).
Current usage metrics show cumulative count of Article Views (full-text article views including HTML views, PDF and ePub downloads, according to the available data) and Abstracts Views on Vision4Press platform.
Data correspond to usage on the plateform after 2015. The current usage metrics is available 48-96 hours after online publication and is updated daily on week days.
Initial download of the metrics may take a while.