Fig. 4
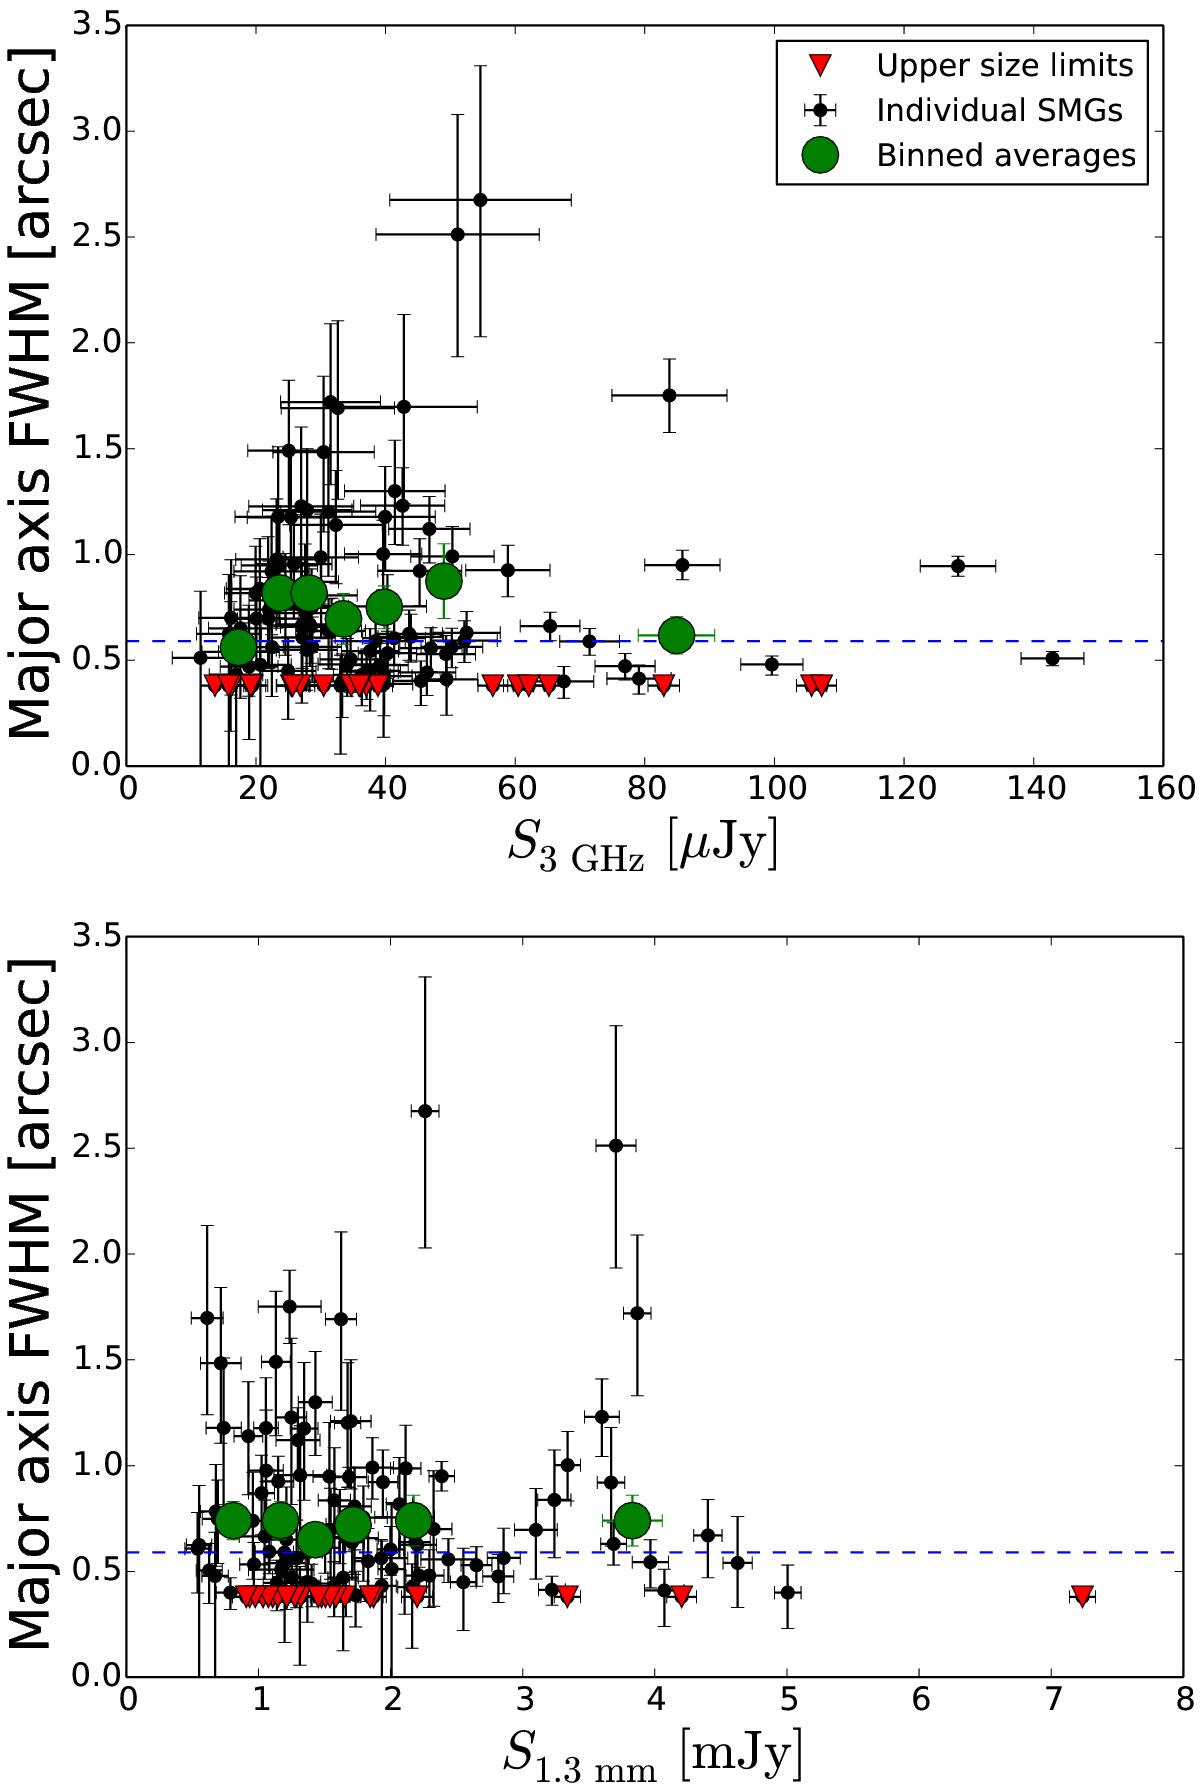
Top: angular major axis FWHM size distribution of the 3 GHz emission as a function of the 3 GHz flux density. AzTEC/C61 and C77a, which have 3 GHz flux densities of S3 GHz = 11.5 mJy and S3 GHz = 261μJy, respectively, are omitted from the plot for legibility purposes. The horizontal dashed line marks the median major axis FWHM of ![]() . The upper size limits are indicated by red, downwards pointing triangles. The green filled circles represent the mean values of the binned data (each bin is equally populated by 16 SMGs, except the highest flux density bin, which contains 17 SMGs, and where C61 and C77a have not been taken into account), with the error bars showing the standard errors of the mean values. Bottom: same as above but as a function of the ALMA 1.3 mm flux density. Again, the green filled circles represent the binned averages, where each bin contains 19 SMGs, except the highest flux density bin, which contains 20 SMGs (all the sources, including AzTEC/C61 and C77a, have been taken into account).
. The upper size limits are indicated by red, downwards pointing triangles. The green filled circles represent the mean values of the binned data (each bin is equally populated by 16 SMGs, except the highest flux density bin, which contains 17 SMGs, and where C61 and C77a have not been taken into account), with the error bars showing the standard errors of the mean values. Bottom: same as above but as a function of the ALMA 1.3 mm flux density. Again, the green filled circles represent the binned averages, where each bin contains 19 SMGs, except the highest flux density bin, which contains 20 SMGs (all the sources, including AzTEC/C61 and C77a, have been taken into account).
Current usage metrics show cumulative count of Article Views (full-text article views including HTML views, PDF and ePub downloads, according to the available data) and Abstracts Views on Vision4Press platform.
Data correspond to usage on the plateform after 2015. The current usage metrics is available 48-96 hours after online publication and is updated daily on week days.
Initial download of the metrics may take a while.