Fig. 3
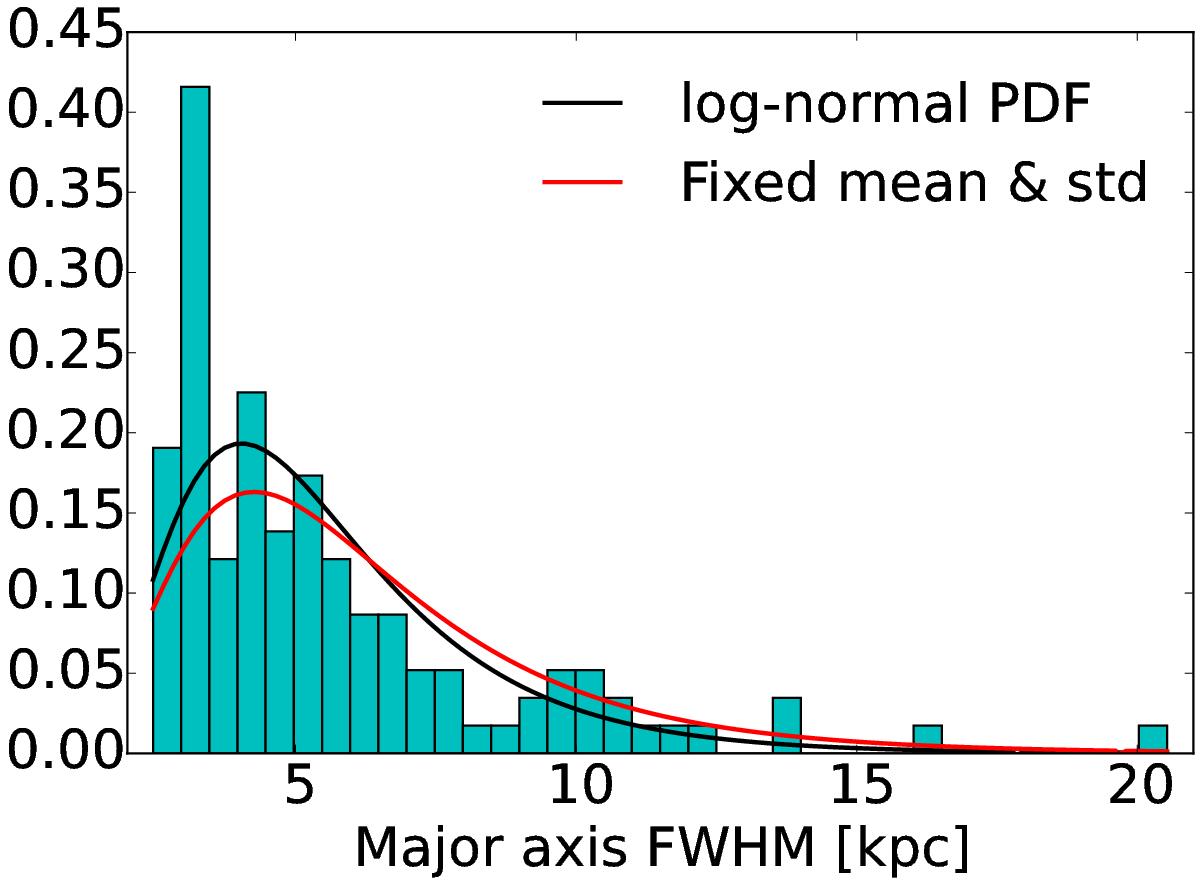
Distribution of the major axis FWHM sizes at 3 GHz shown as a normalised histogram. The upper size limits were placed in the bins corresponding to those values, and the bin width is 0.5 kpc. The solid black curve represents a best-fit PDF to a log-normal size distribution (μ = 5.0 kpc and σ = 2.9 kpc). The PDF shown by the red solid curve was obtained by fixing the values of μ and σ to those derived from a survival analysis (μ = 5.5 kpc and σ = 3.2 kpc).
Current usage metrics show cumulative count of Article Views (full-text article views including HTML views, PDF and ePub downloads, according to the available data) and Abstracts Views on Vision4Press platform.
Data correspond to usage on the plateform after 2015. The current usage metrics is available 48-96 hours after online publication and is updated daily on week days.
Initial download of the metrics may take a while.