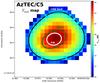
Fig. E.1
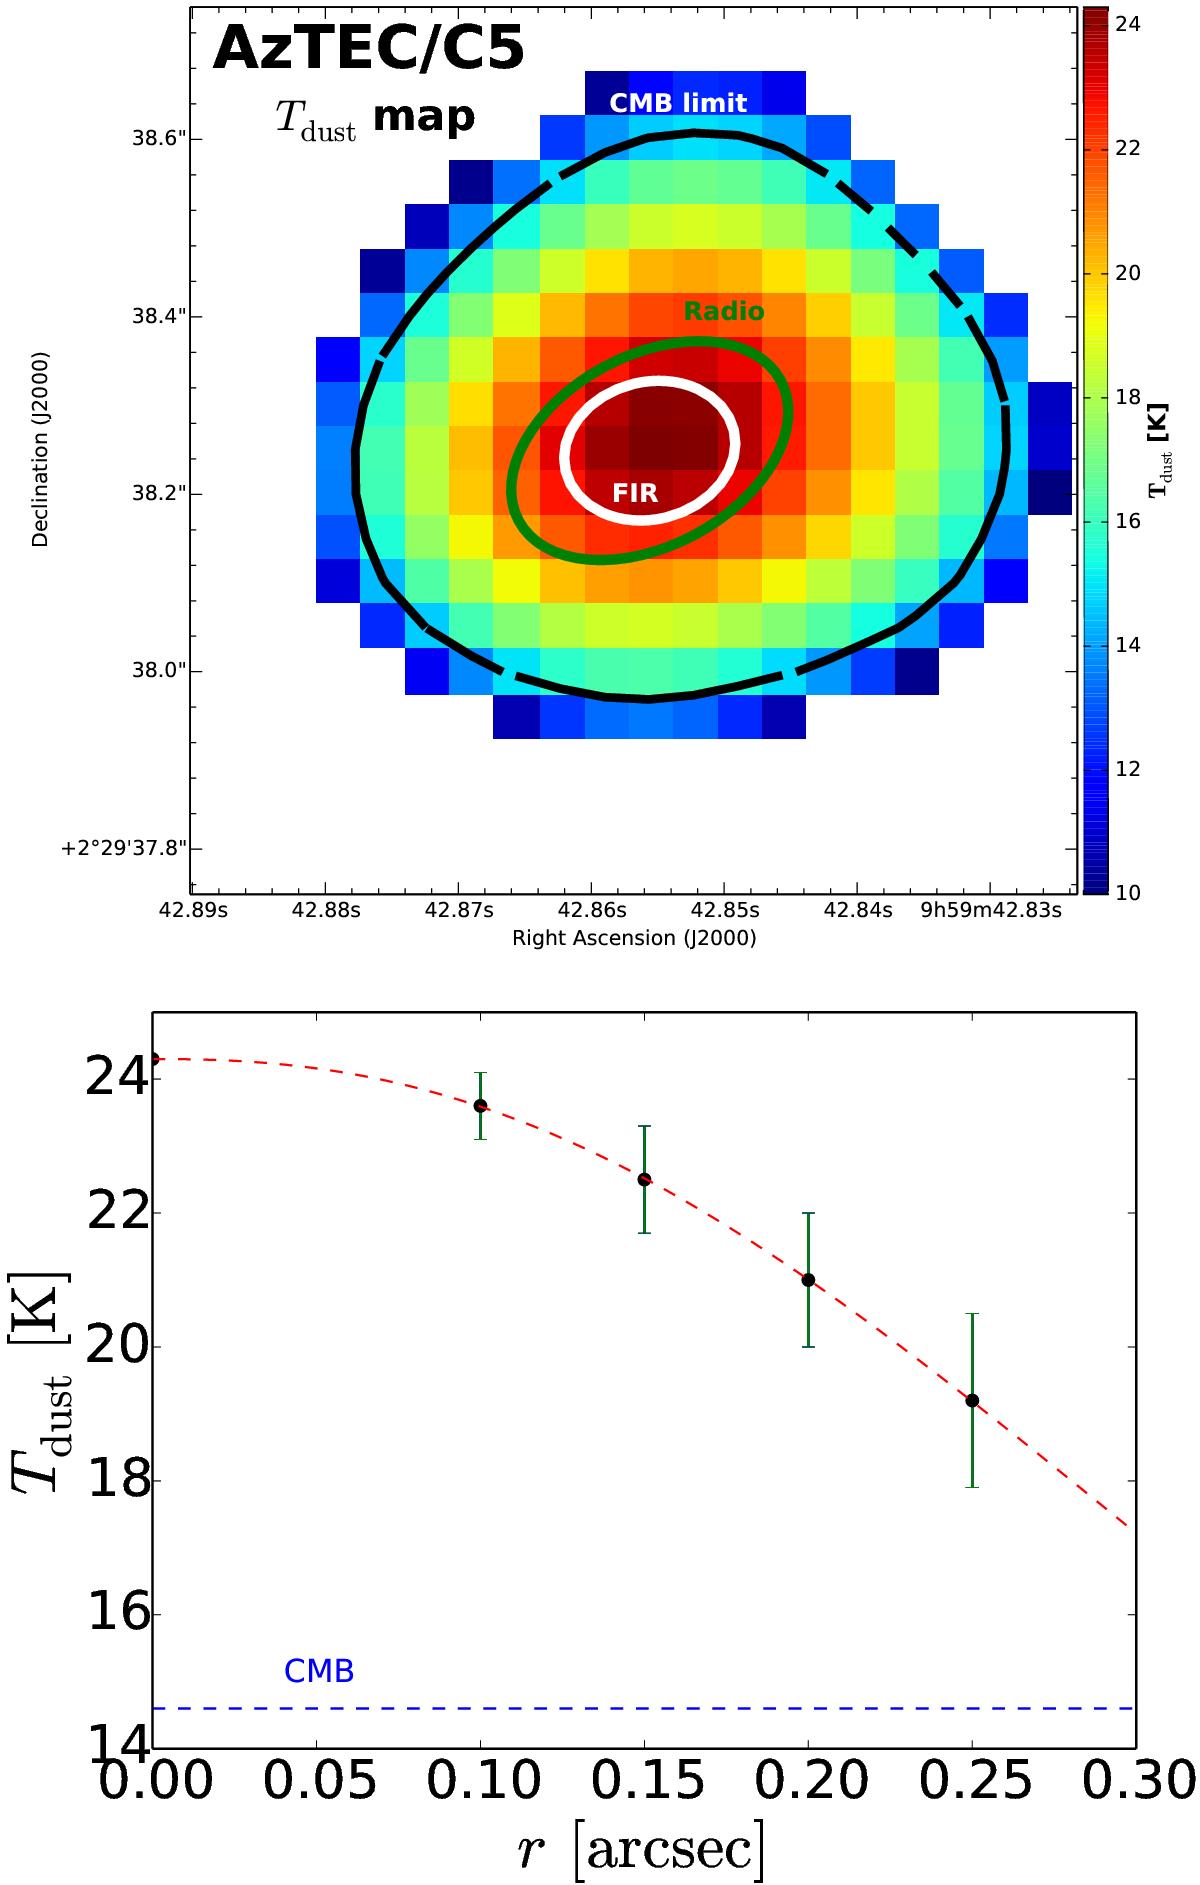
Left: dust temperature map of AzTEC/C5. The dust emissivity index, β, was fixed at 1.5. The colourbar on the right indicates the units in kelvin. The two ellipses show the dust and radio-emitting FWHM extents as in Fig. D.1. The thick black line indicates the border where the dust temperature drops to the CMB temperature at the source redshift (TCMB(z = 4.3415) = 14.6 K). Right: radial profile of the cold dust temperature of AzTEC/C5. The data points represent azimuthally averaged values inside ![]() wide circular annuli, and the vertical error bars represent the standard deviations of these averages. The red dashed line shows the mean radial Tdust(r) profile fitted using Eq. (E.3). The CMB temperature floor is shown by a horizontal blue dashed line, and is met with the Tdust(r) profile at
wide circular annuli, and the vertical error bars represent the standard deviations of these averages. The red dashed line shows the mean radial Tdust(r) profile fitted using Eq. (E.3). The CMB temperature floor is shown by a horizontal blue dashed line, and is met with the Tdust(r) profile at ![]() .
.
Current usage metrics show cumulative count of Article Views (full-text article views including HTML views, PDF and ePub downloads, according to the available data) and Abstracts Views on Vision4Press platform.
Data correspond to usage on the plateform after 2015. The current usage metrics is available 48-96 hours after online publication and is updated daily on week days.
Initial download of the metrics may take a while.