Fig. A.1
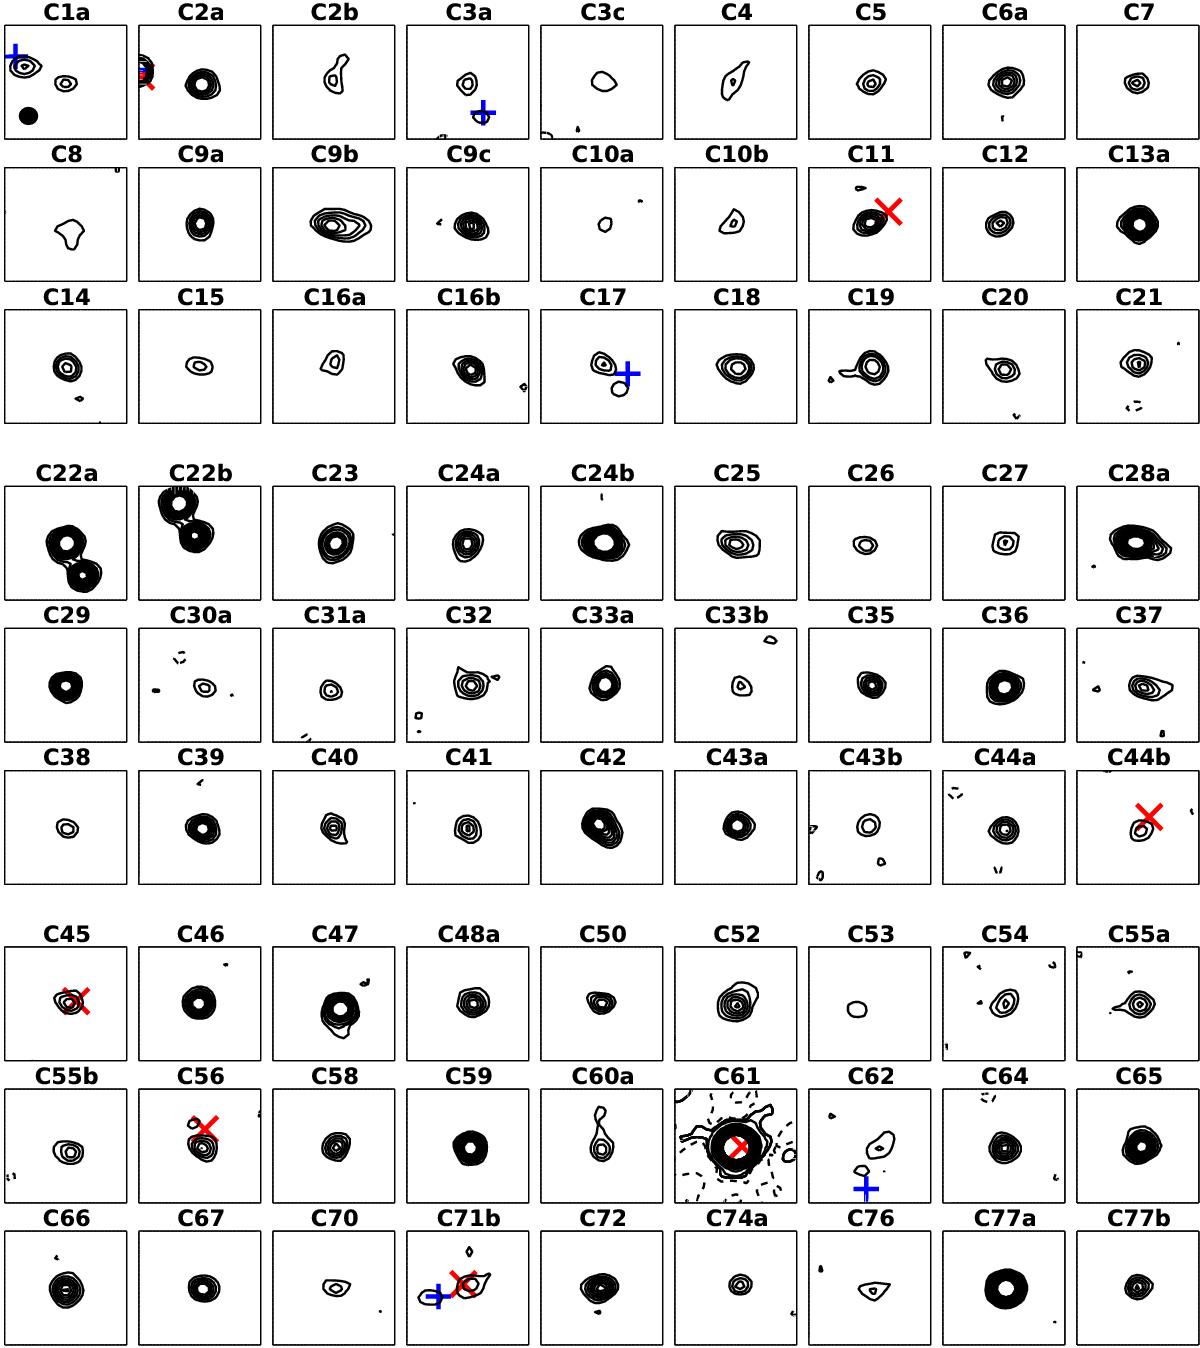
VLA 3 GHz contour maps of our 3 GHz detected SMGs. Each image is centred on the ALMA 1.3 mm peak position, is 5″ × 5″ in size, and displayed with north up and east left. The contour levels start from 3σ, and progress in steps of 2σ except for AzTEC/C61 where the level step is 15σ. The dashed contours show the negative features at the −3σ level. The blue plus signs and red crosses mark, respectively, the positions of the optical-NIR and X-ray sources seen towards those 3 GHz sources that are discussed in Appendix B and Sect. 2.1. The black filled circle in the first panel (AzTEC/C1a) shows the synthesised beam size of ![]() (FWHM). The projected angular offset between the ALMA source position (i.e. the image centre position) and the 3 GHz peak position is given in Col. (11) in Table C.1.
(FWHM). The projected angular offset between the ALMA source position (i.e. the image centre position) and the 3 GHz peak position is given in Col. (11) in Table C.1.
Current usage metrics show cumulative count of Article Views (full-text article views including HTML views, PDF and ePub downloads, according to the available data) and Abstracts Views on Vision4Press platform.
Data correspond to usage on the plateform after 2015. The current usage metrics is available 48-96 hours after online publication and is updated daily on week days.
Initial download of the metrics may take a while.