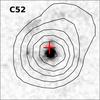
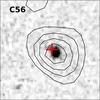
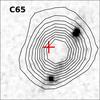
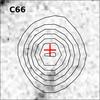
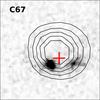
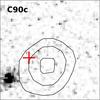
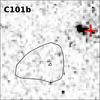
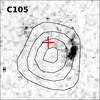
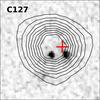
Fig. 12
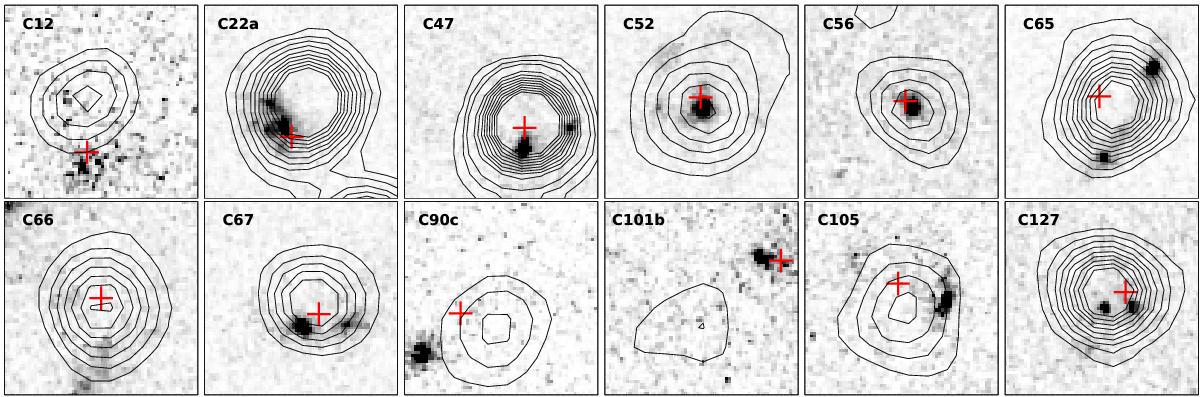
Hubble/ACS I-band images of the 3 GHz detected SMGs whose morphological classification in the rest-frame UV is uncertain as discussed in Sect. 4.4. The greyscale is inverted, and displayed using a power-law stretch to better show the low and high surface brightness features. The black contours show the 3 GHz radio emission as in Fig. A.1. Each image is centred on the ALMA 1.3 mm peak position, is 2″ × 2″ in size, and displayed with north up and east left. The red plus signs mark the positions of the optical-NIR counterparts for which the photometric redshifts were derived by Brisbin et al. (2017), except towards C66 where the plus sign marks the ALMA position from which the optical-NIR photometry was manually extracted owing to blending issues.
Current usage metrics show cumulative count of Article Views (full-text article views including HTML views, PDF and ePub downloads, according to the available data) and Abstracts Views on Vision4Press platform.
Data correspond to usage on the plateform after 2015. The current usage metrics is available 48-96 hours after online publication and is updated daily on week days.
Initial download of the metrics may take a while.