Fig. 11
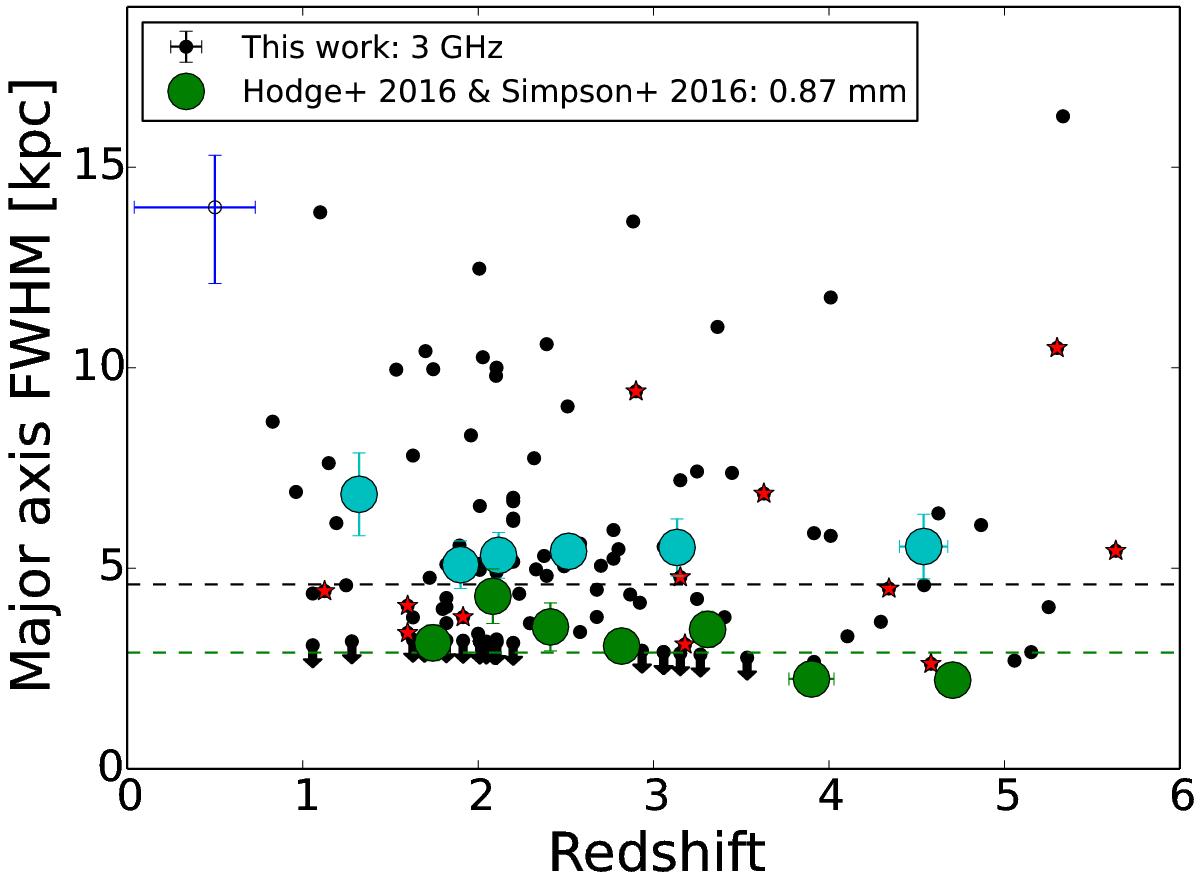
Linear major axis FWHM sizes [kpc] of our SMGs at 3 GHz plotted as a function of redshift (black points). The upper size limits are indicated by downwards pointing arrows. Those AzTEC SMGs from M15 that are common with the present sample are highlighted by red star symbols. The cyan filled circles represent the mean values of the binned version of the data (each bin contains 19 SMGs, except the highest redshift bin that contains 20 sources). For the sake of clarity, individual error bars are not shown for our data, but a representative (median) error bar is shown in the top left corner. Also shown are the 870 μm sizes from Hodge et al. (2016) and Simpson et al. (2017) discussed in Sect. 4.2.2; the green filled circles represent the binned averages of their combined data sets. The horizontal black and green dashed lines show the corresponding full sample median major axis FWHM values of 4.6 kpc and 2.9 kpc, respectively.
Current usage metrics show cumulative count of Article Views (full-text article views including HTML views, PDF and ePub downloads, according to the available data) and Abstracts Views on Vision4Press platform.
Data correspond to usage on the plateform after 2015. The current usage metrics is available 48-96 hours after online publication and is updated daily on week days.
Initial download of the metrics may take a while.