Fig. 2
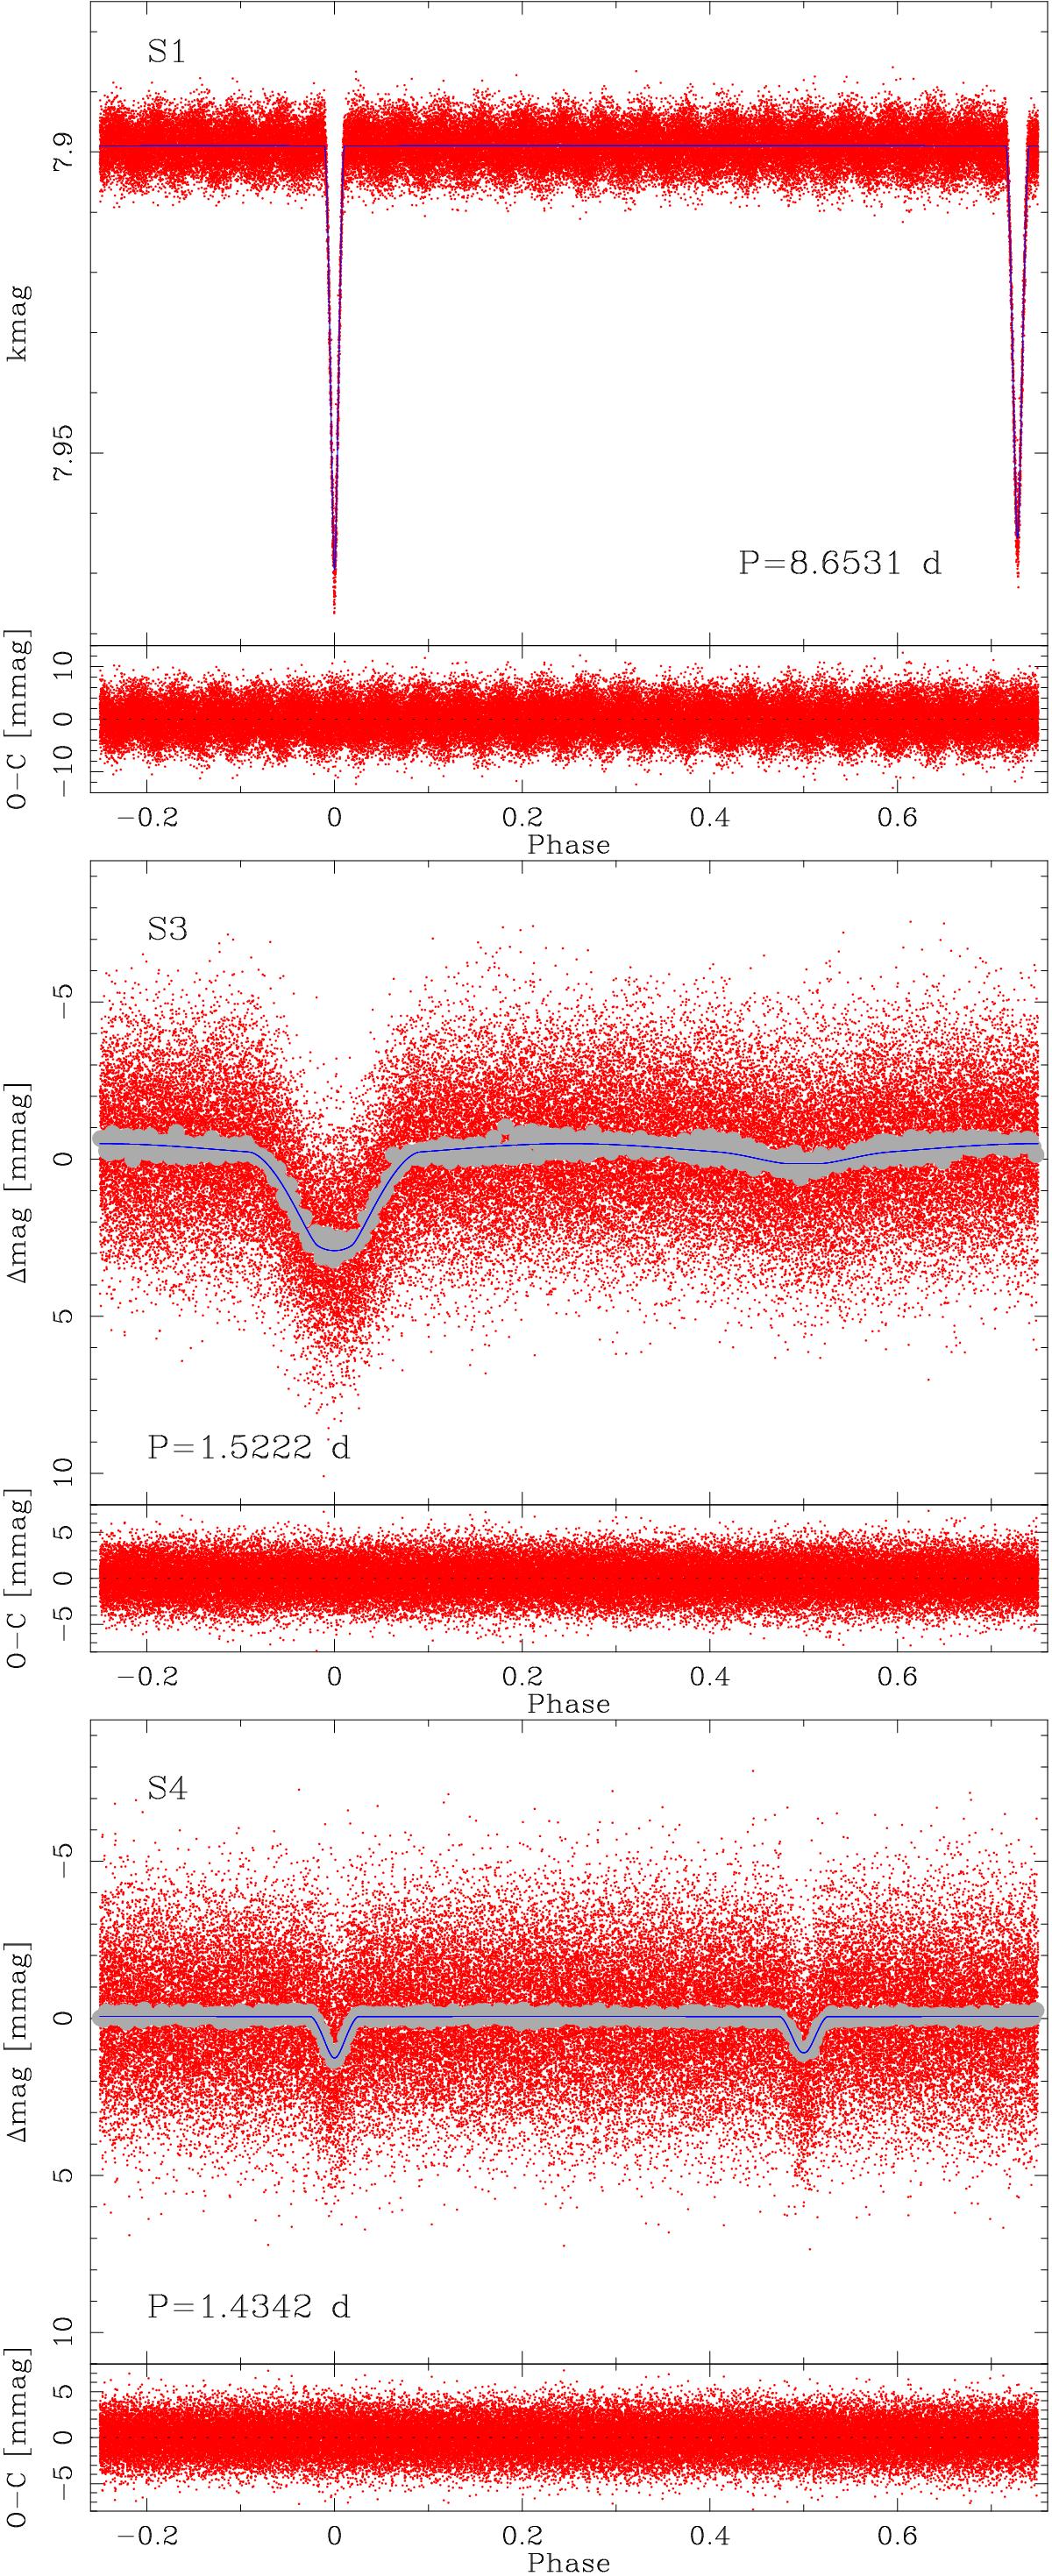
S1 (top), S3 (middle), and S4 (bottom) light curves, representing three out of four periods of eclipses observed in the KIC 4150611 system. Red dots are the observations (S1) or residuals of previous fits cleaned from pulsations (S3 and S4). Grey symbols are bins of 200 points in phase domain. Blue lines are the JKTEBOP models. Please note the change of the spread of residuals of each fit (lower panels). The respective parameters are listed in Table 3.
Current usage metrics show cumulative count of Article Views (full-text article views including HTML views, PDF and ePub downloads, according to the available data) and Abstracts Views on Vision4Press platform.
Data correspond to usage on the plateform after 2015. The current usage metrics is available 48-96 hours after online publication and is updated daily on week days.
Initial download of the metrics may take a while.