Fig. 9
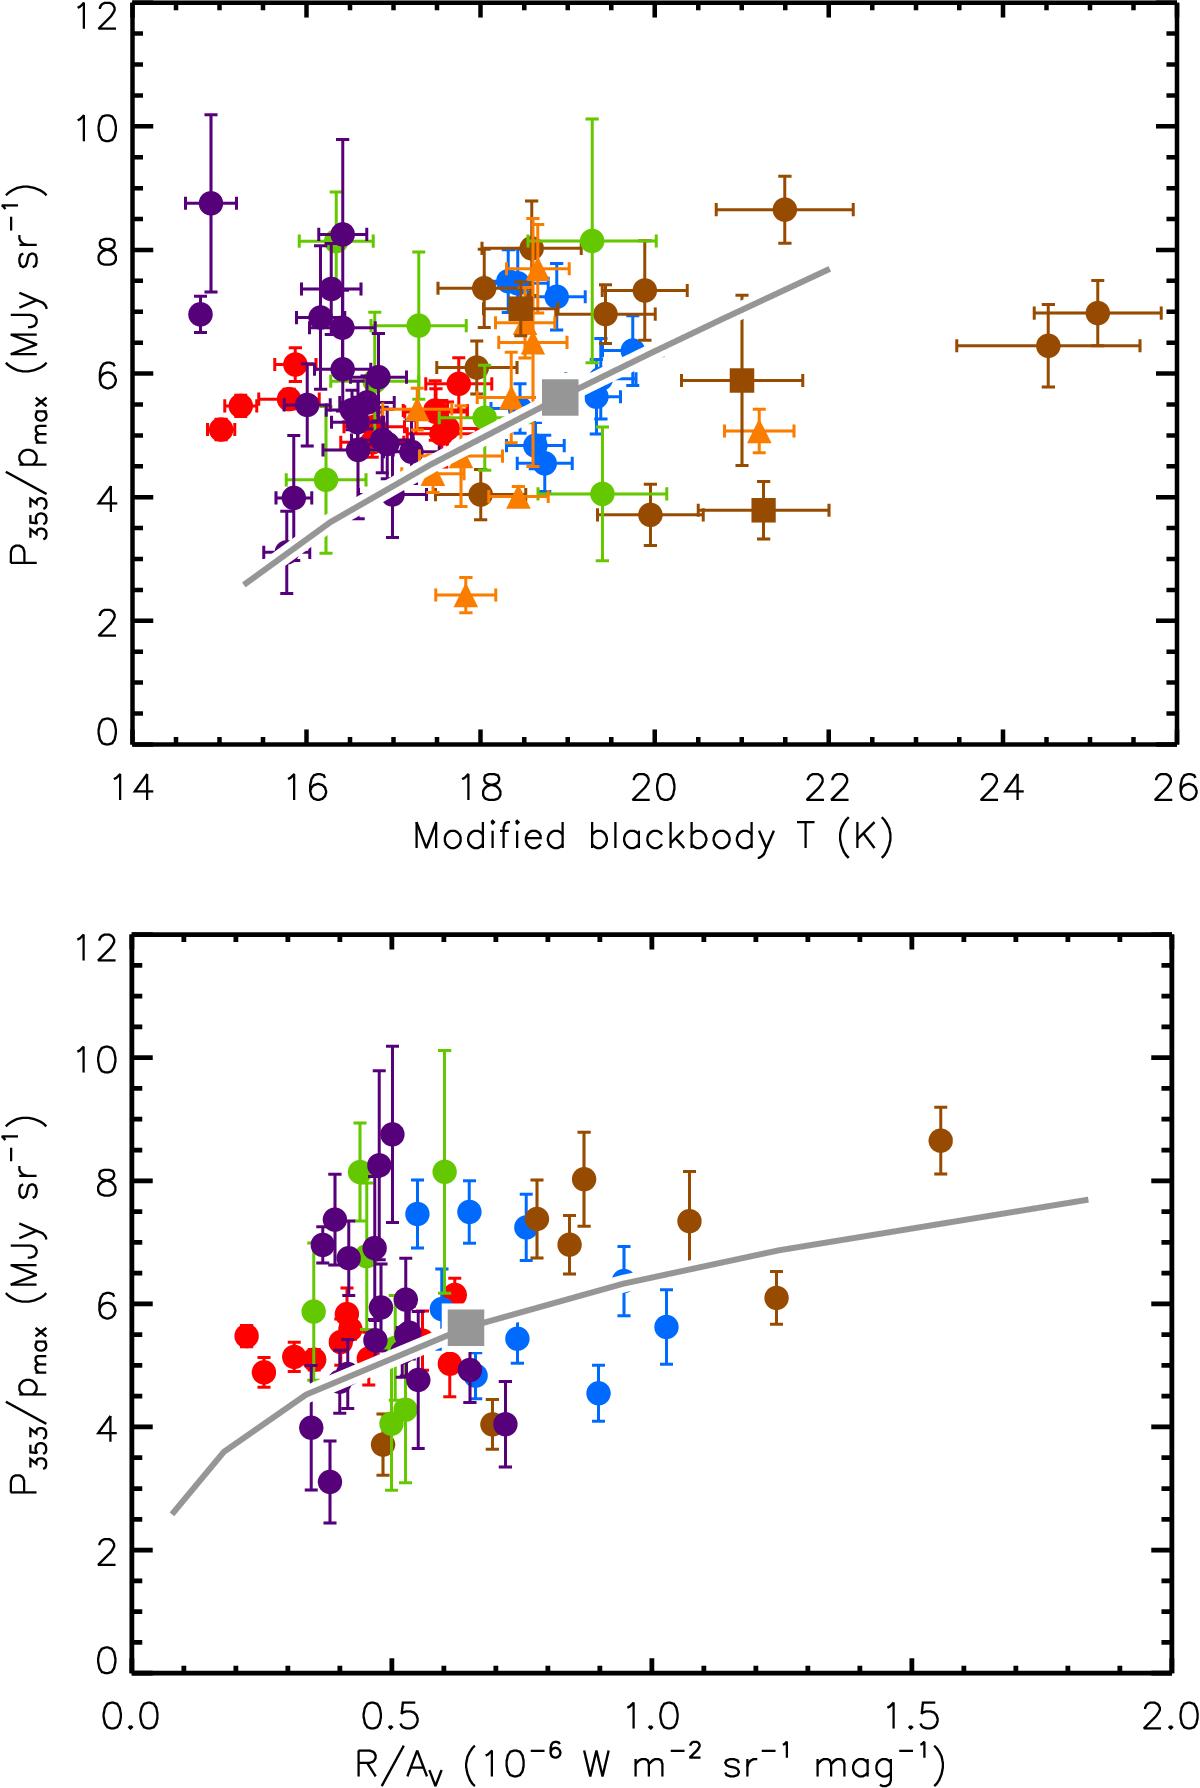
P353/pmax ratio as a function of the modified blackbody temperature (top panel) and as a function of the normalized radiance ℛ /AV (bottom panel). The bottom panel does not include stars without AV and pV measurements. The grey curves show the model for varying intensity of the radiation field (0.1 ≤ G0 ≤ 3).The grey square marks the position of the standard model. The color and symbol scheme for the observarions are the same as in Fig. 2.
Current usage metrics show cumulative count of Article Views (full-text article views including HTML views, PDF and ePub downloads, according to the available data) and Abstracts Views on Vision4Press platform.
Data correspond to usage on the plateform after 2015. The current usage metrics is available 48-96 hours after online publication and is updated daily on week days.
Initial download of the metrics may take a while.