Free Access
Fig. 8
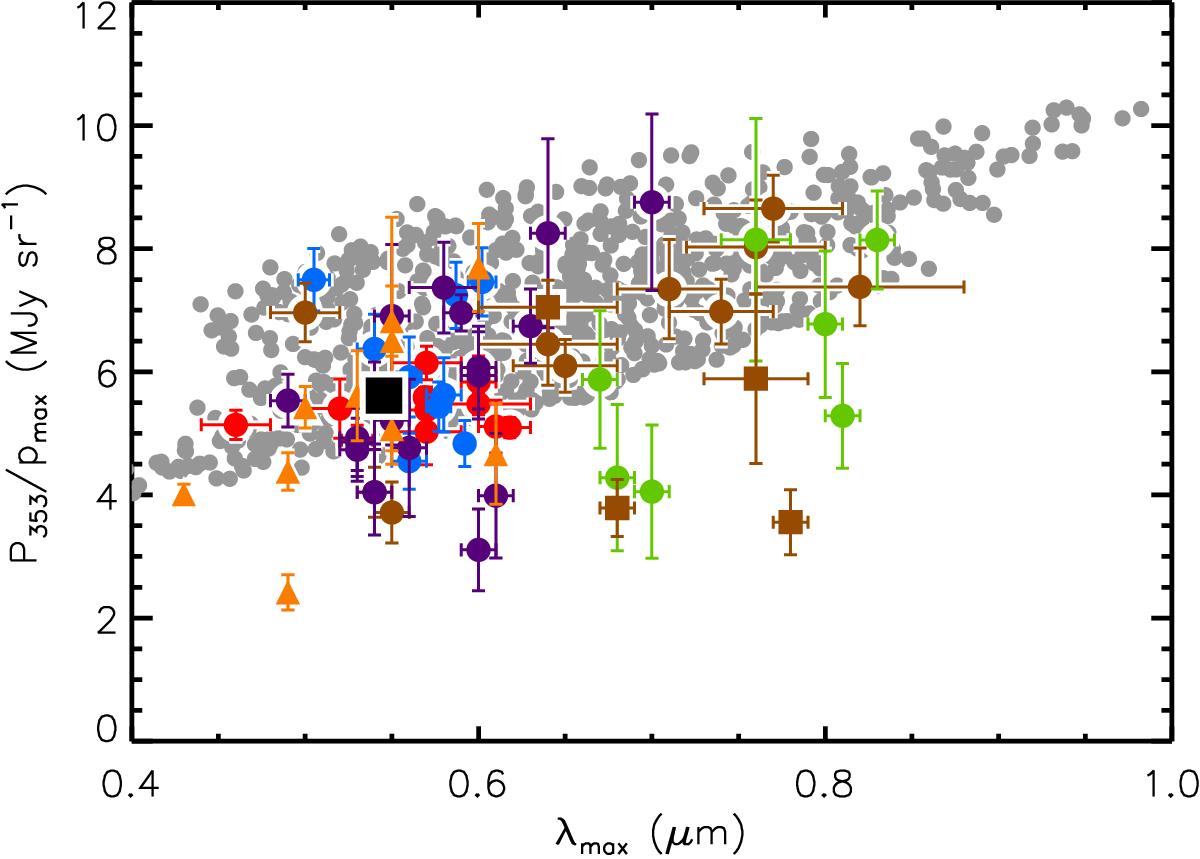
Observational polarization ratio P353/pmax compared with Monte Carlo iterations of the model (grey). The black square marks the position of the standard model. The color and symbol scheme are the same as in Fig. 2.
Current usage metrics show cumulative count of Article Views (full-text article views including HTML views, PDF and ePub downloads, according to the available data) and Abstracts Views on Vision4Press platform.
Data correspond to usage on the plateform after 2015. The current usage metrics is available 48-96 hours after online publication and is updated daily on week days.
Initial download of the metrics may take a while.