Fig. 2
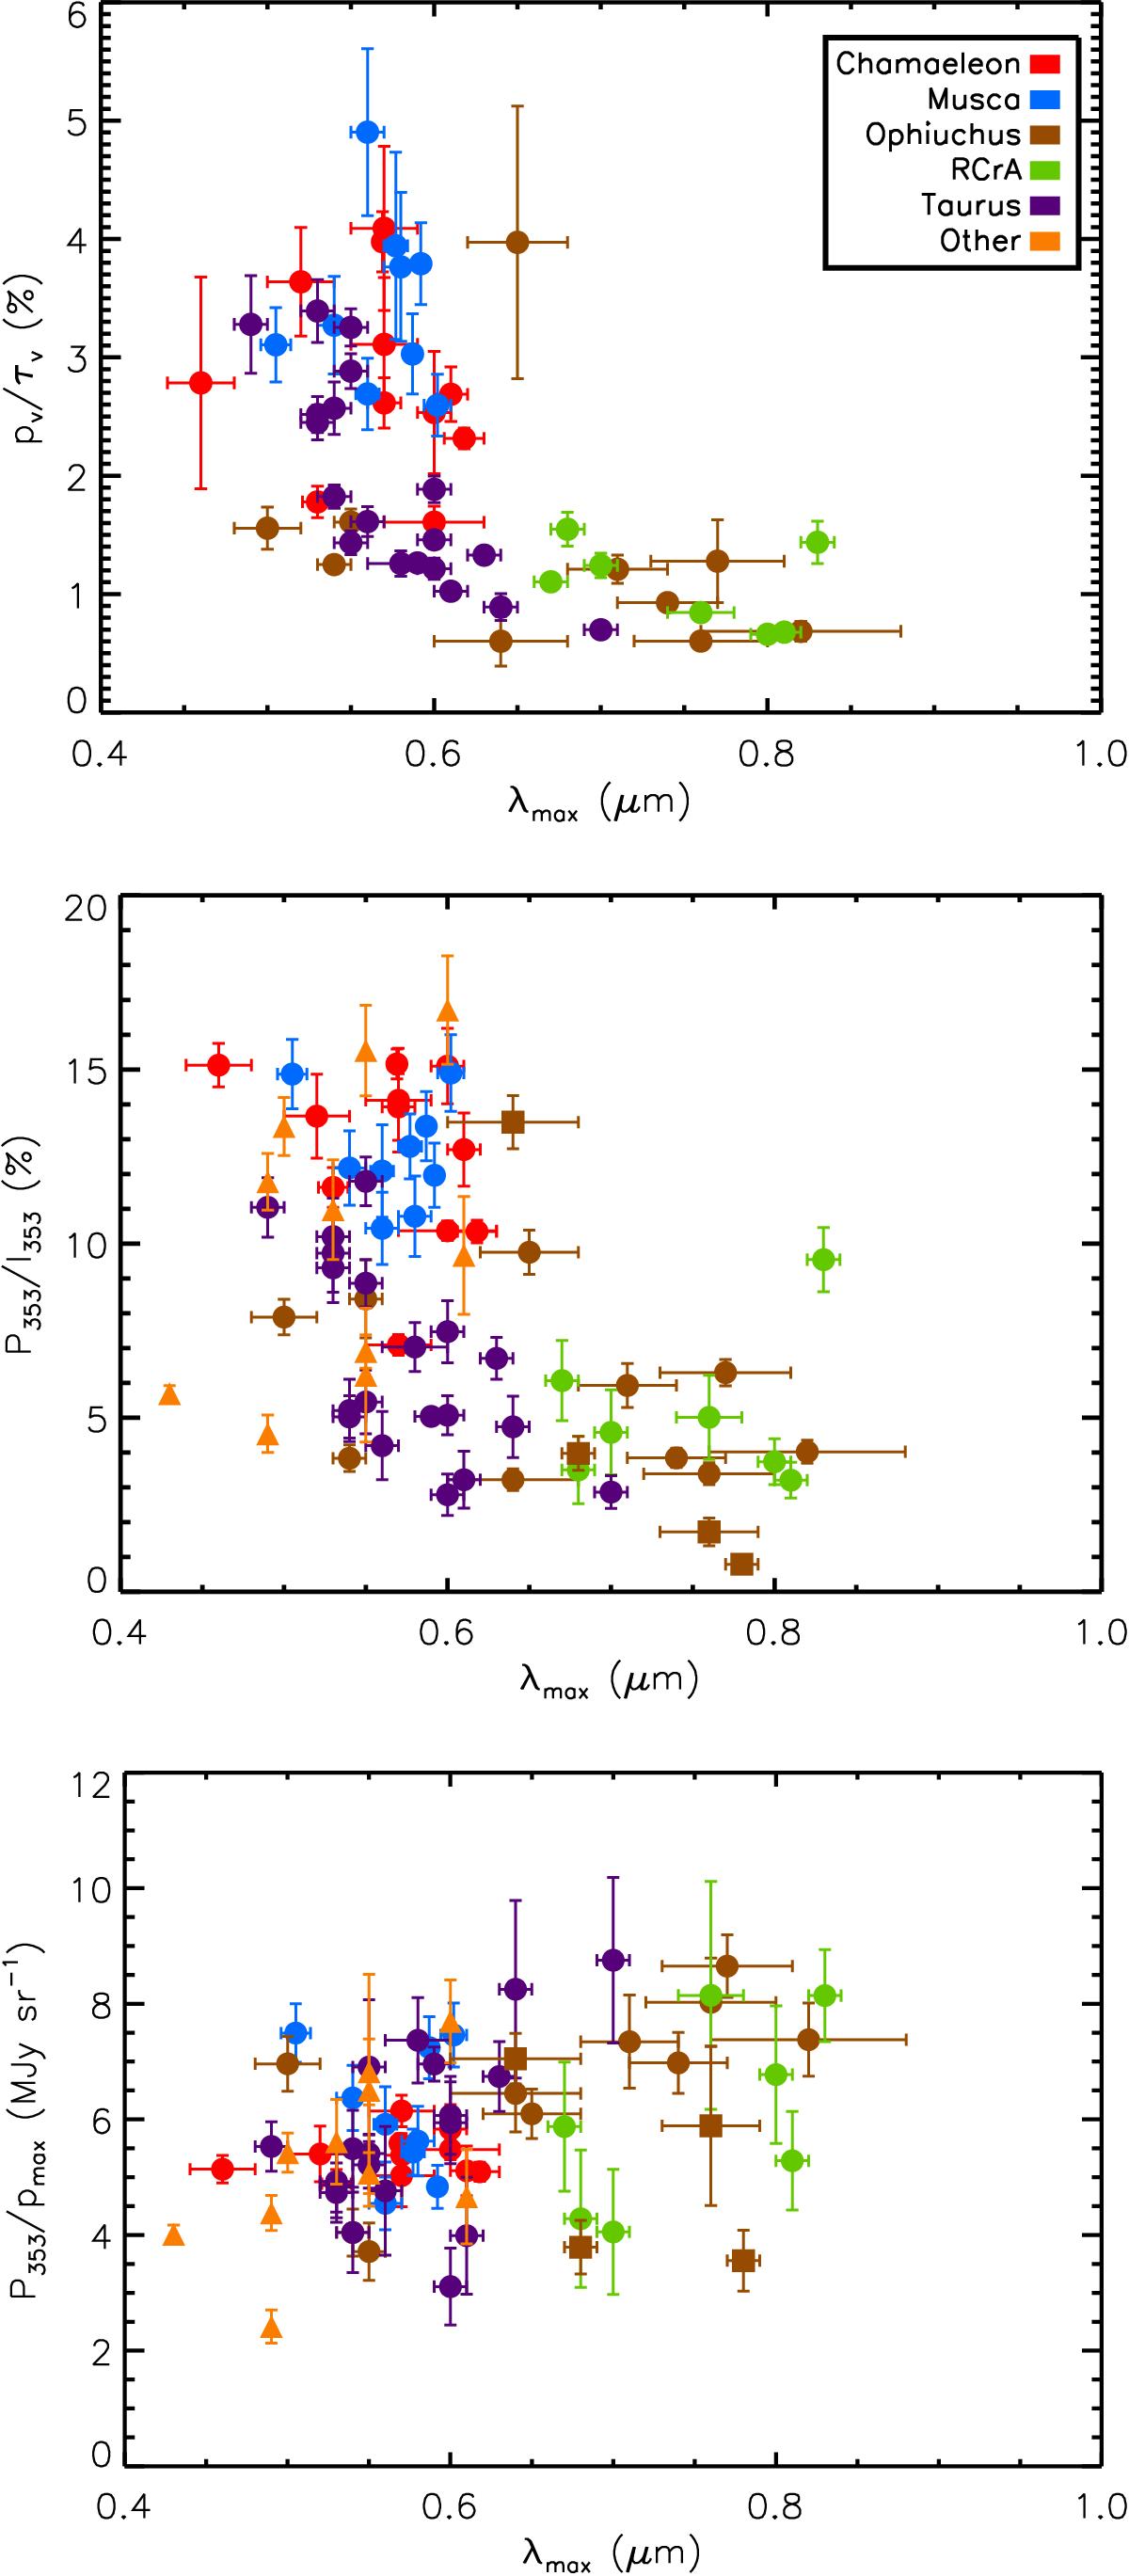
Observational data to reproduce. Different colors indicate different clouds, different symbols indicate different references (circles: AP07; triangles: Anderson et al. 1996, squares: Martin et al. 1992). Top: the “classical” pV/τ vs. λmax plot. This panel does not contain the stars without AV and pV measurements. Center: comparison of λmax in extinction with the polarization P353/I353 in emission. Bottom: the ratio of polarization P353/pmax as a function of λmax.
Current usage metrics show cumulative count of Article Views (full-text article views including HTML views, PDF and ePub downloads, according to the available data) and Abstracts Views on Vision4Press platform.
Data correspond to usage on the plateform after 2015. The current usage metrics is available 48-96 hours after online publication and is updated daily on week days.
Initial download of the metrics may take a while.