Fig. A.2
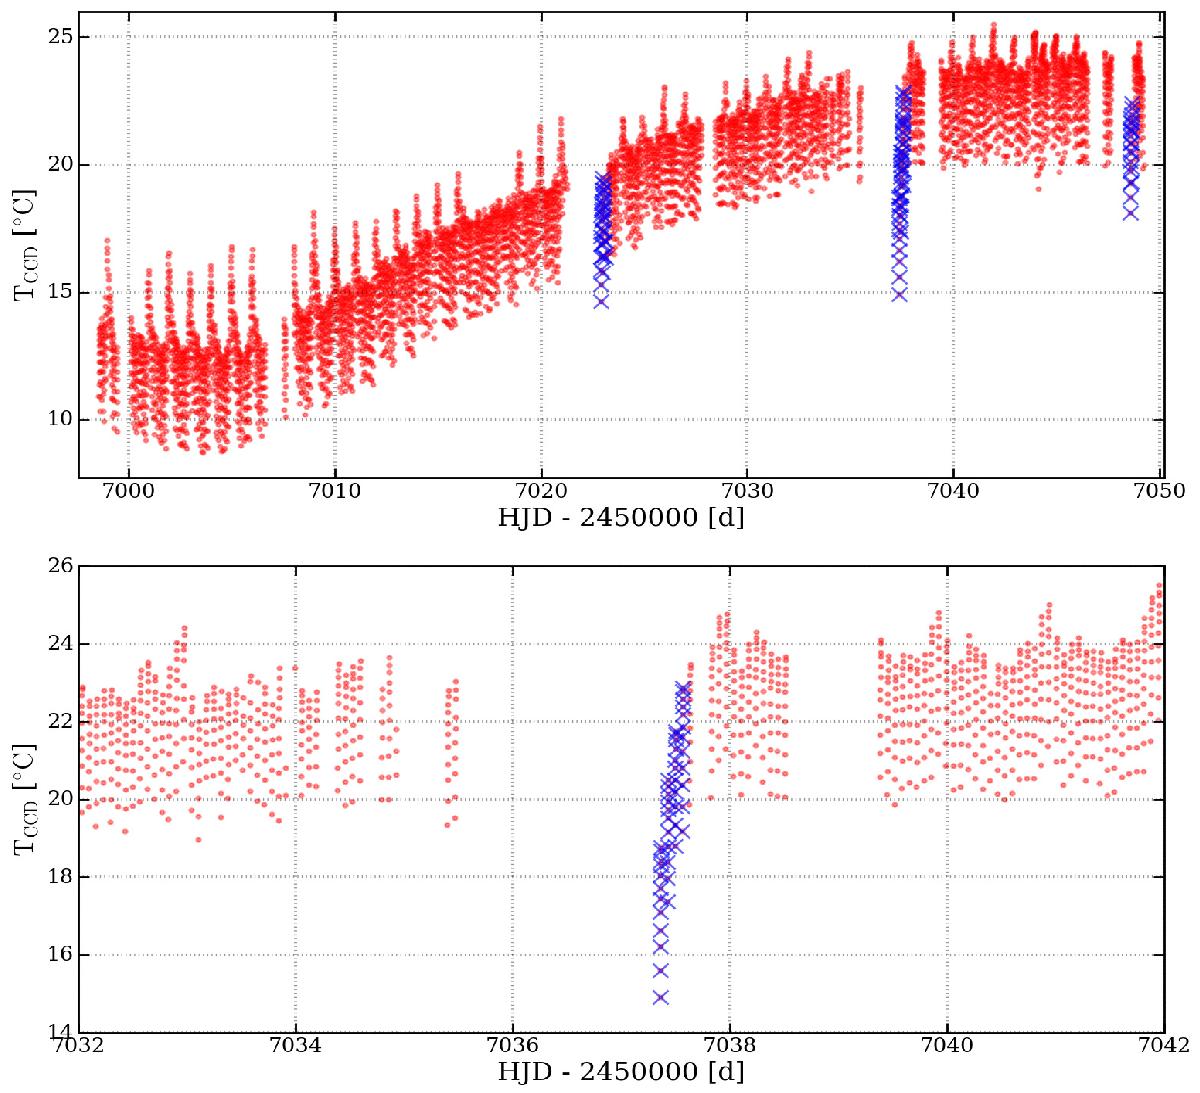
Top: varying onboard temperature, measured at the CCD, is indicated in red for the setup 5 file of BHr during the Orion II campaign. The orbits having a different long-term behavior are rejected and indicated by blue crosses, which mostly happens after a significant data gap. Bottom: zoom of the top panel around the second marked region at HJD = 2 457 037.
Current usage metrics show cumulative count of Article Views (full-text article views including HTML views, PDF and ePub downloads, according to the available data) and Abstracts Views on Vision4Press platform.
Data correspond to usage on the plateform after 2015. The current usage metrics is available 48-96 hours after online publication and is updated daily on week days.
Initial download of the metrics may take a while.