Fig. A.1
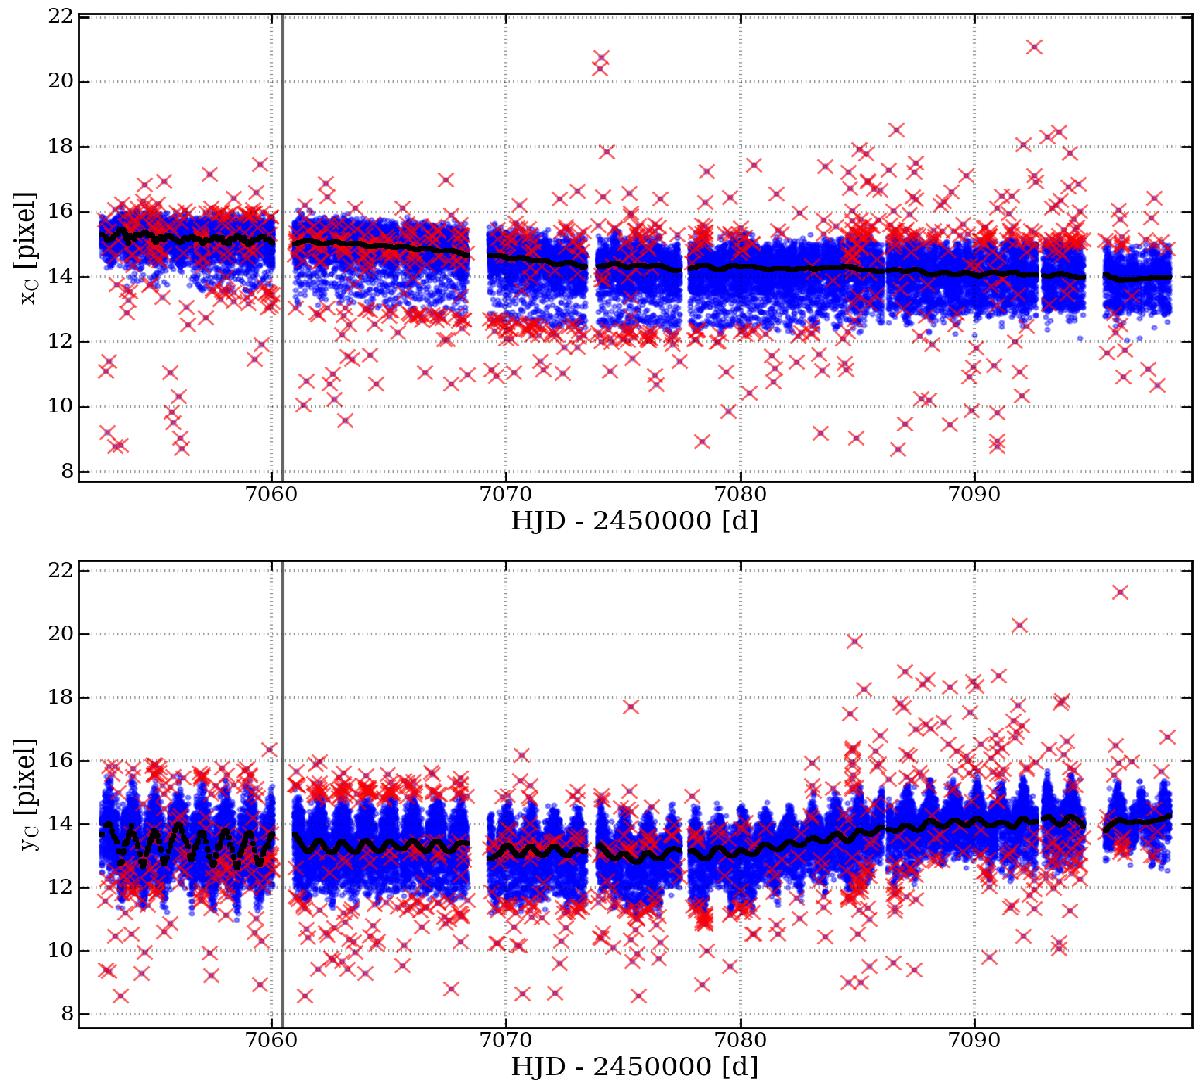
Behavior of the CCD centroid positions with respect to time for the setup 6 file of BLb during the Orion II campaign at blue wavelengths. The model for the behavior is marked in black, while the merged outliers from both centroid positions are marked by the red crosses. These outliers occur in the outer 0.8% of the model corrected centroid positions. This data file was corrected with different models for each one of the two distinct regions, indicated by the vertical line at HJD = 2 457 060.5d.
Current usage metrics show cumulative count of Article Views (full-text article views including HTML views, PDF and ePub downloads, according to the available data) and Abstracts Views on Vision4Press platform.
Data correspond to usage on the plateform after 2015. The current usage metrics is available 48-96 hours after online publication and is updated daily on week days.
Initial download of the metrics may take a while.