Free Access
Fig. 5
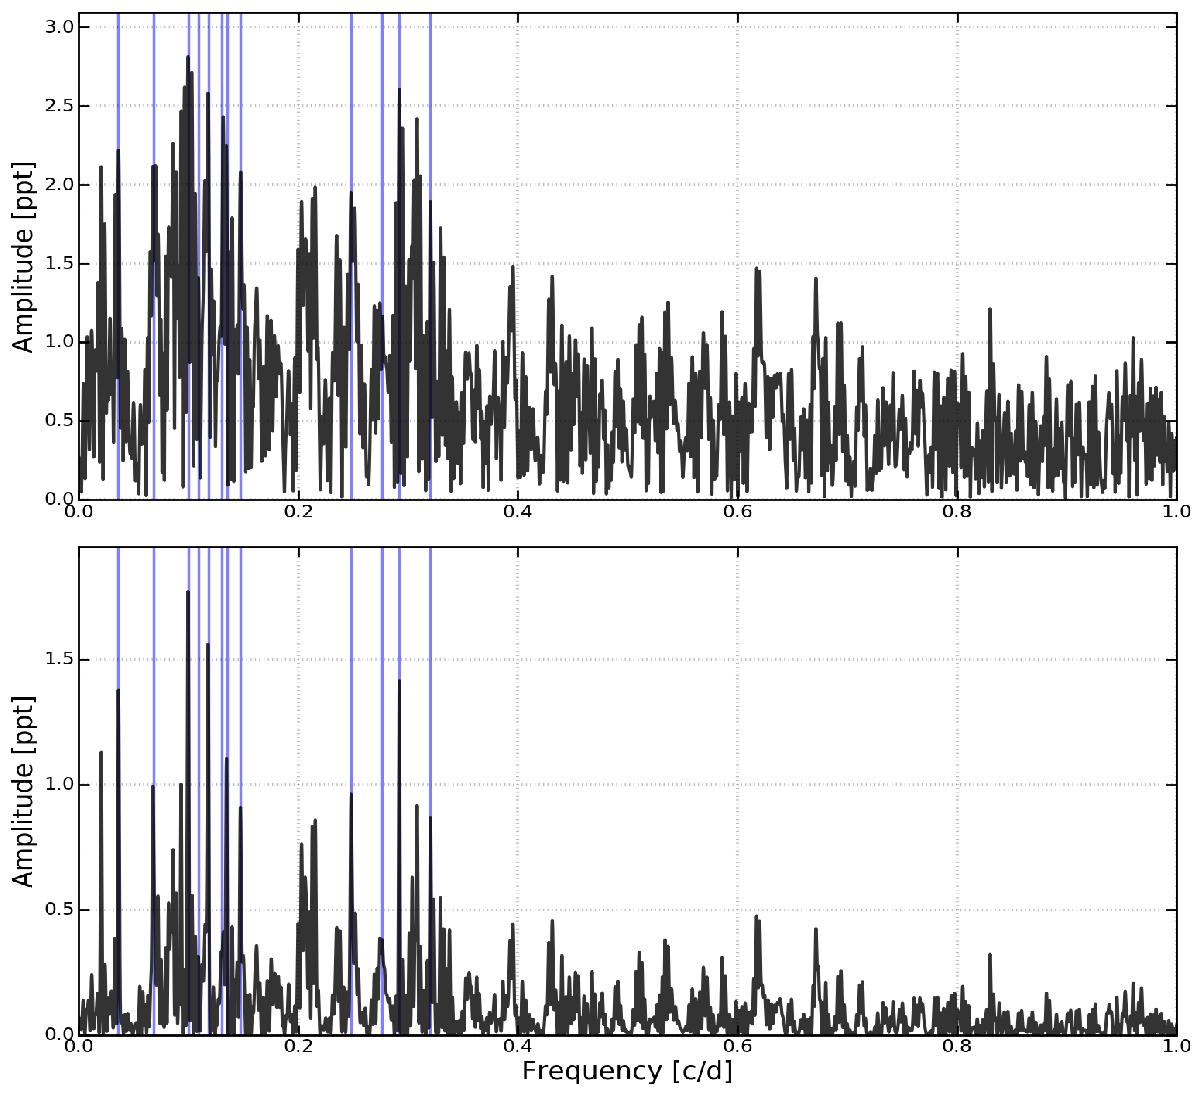
Different periodograms of the combined BRITE lightcurve for ζ Ori. Top: regular Lomb-Scargle periodogram, significantly influenced by the spectral window. Bottom: CLEAN periodogram, using ten iterations and a gain of 0.5, showing the variability more clearly. Extracted significant periodic variability is marked in blue.
Current usage metrics show cumulative count of Article Views (full-text article views including HTML views, PDF and ePub downloads, according to the available data) and Abstracts Views on Vision4Press platform.
Data correspond to usage on the plateform after 2015. The current usage metrics is available 48-96 hours after online publication and is updated daily on week days.
Initial download of the metrics may take a while.